React, D3 and
the Dataviz Ecosystem
React, D3 and
the Dataviz Ecosystem
Online

Next up
- D3
- React
- React + D3
- Choosing an approach
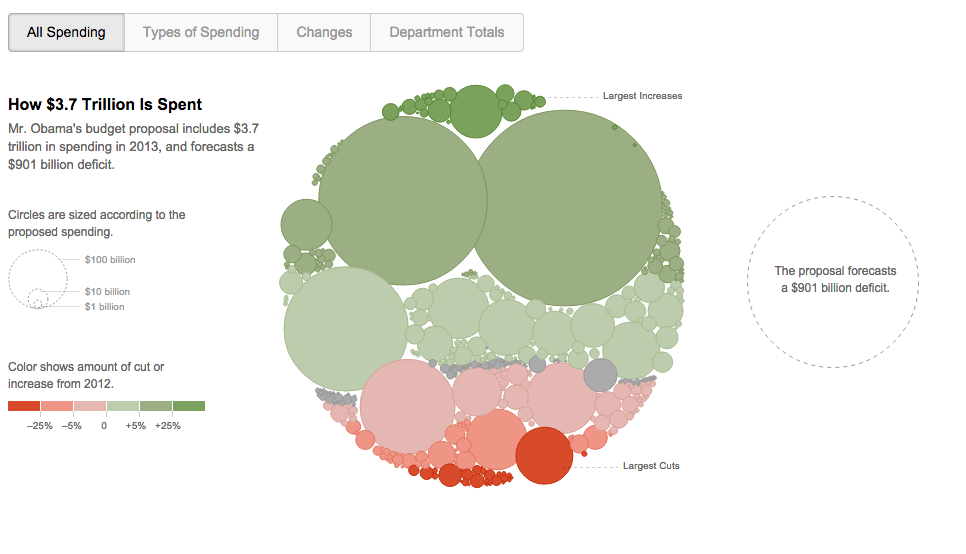
What is D3.js?
- Data-Driven Documents
- Low level, General Purpose Visualization Library
- Manipulates data-based documents
- Open web standards
- Interactive charts
How does it work?
- Loads data
- Binds data to elements
- Transforms those elements
- Transitions between states
D3 Demo
D3 v4 Update
- More modular
- Improved API
- Breaking changes
- Highly adopted
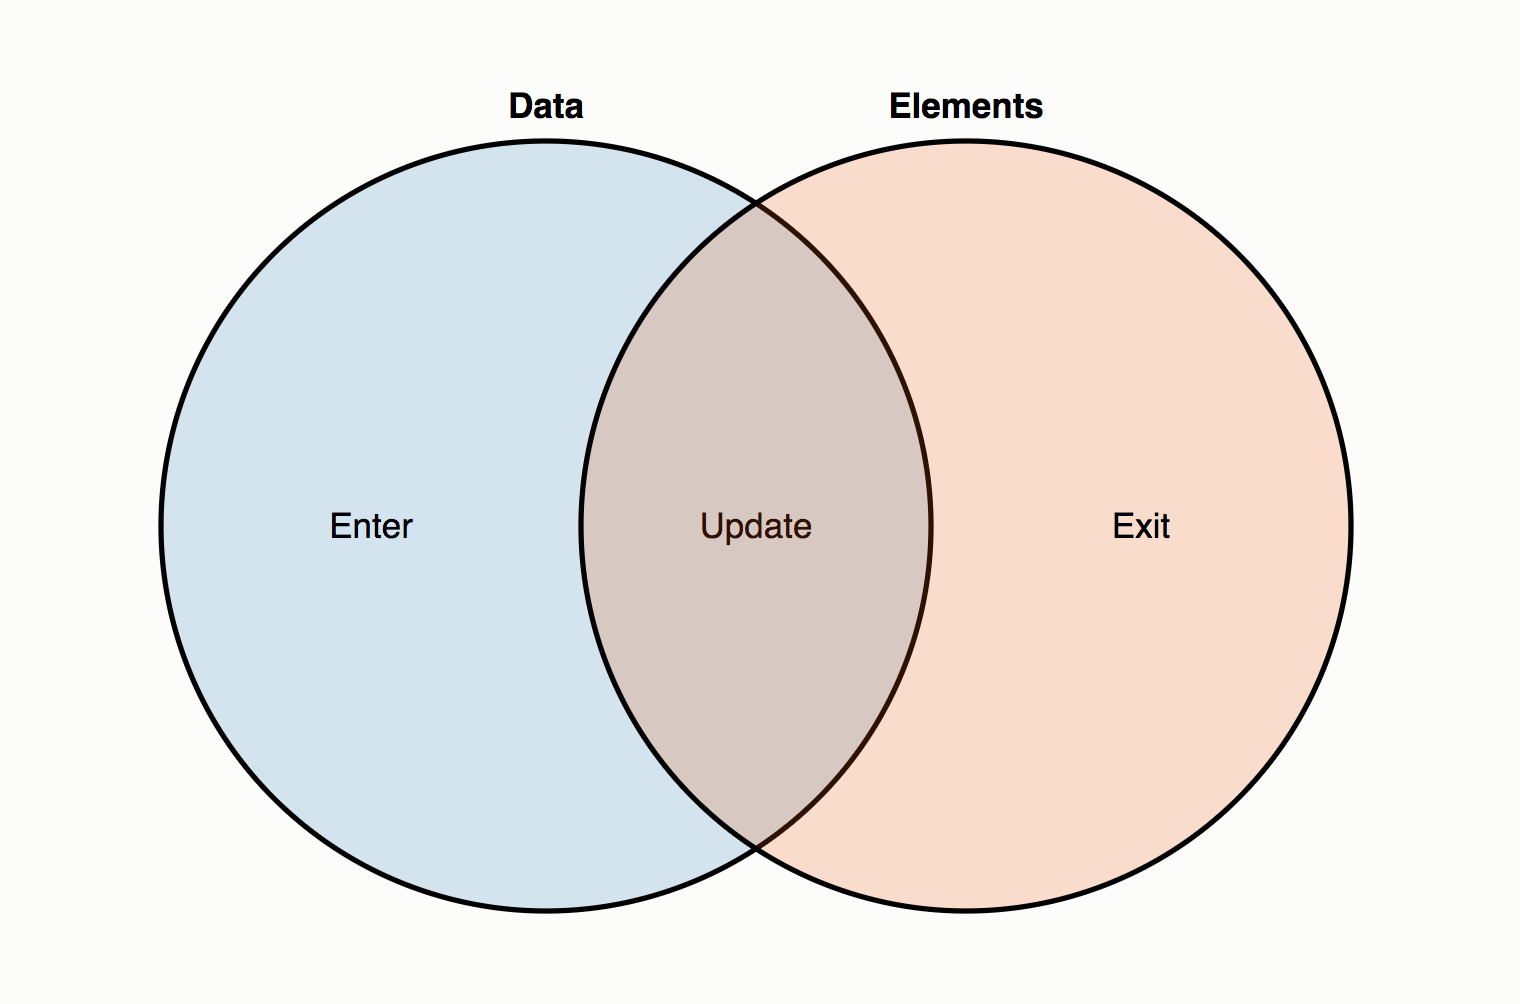
D3 Data Joins
Transforms the DOM by selecting elements and joining to data
Data Join Code
g.selectAll(".bar")
    .data(data)
    .enter()
      .append("rect")
        .attr("class", "bar")
        .attr("x", function(d) { return x(d.letter); })
        .attr("y", function(d) { return y(d.frequency); })
        .attr("width", x.bandwidth())
        .attr("height", function(d) { return height - y(d.frequency); });
Data Join
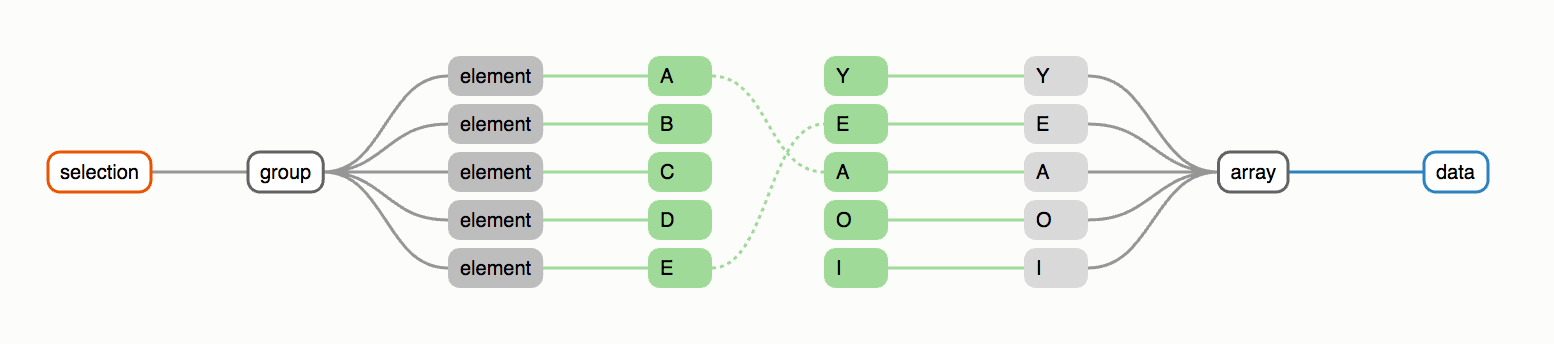
Update, Enter
and Exit Pattern
Resources
D3 Patterns and
Best Practices
Component Patterns
D3 Testing
D3 is hard
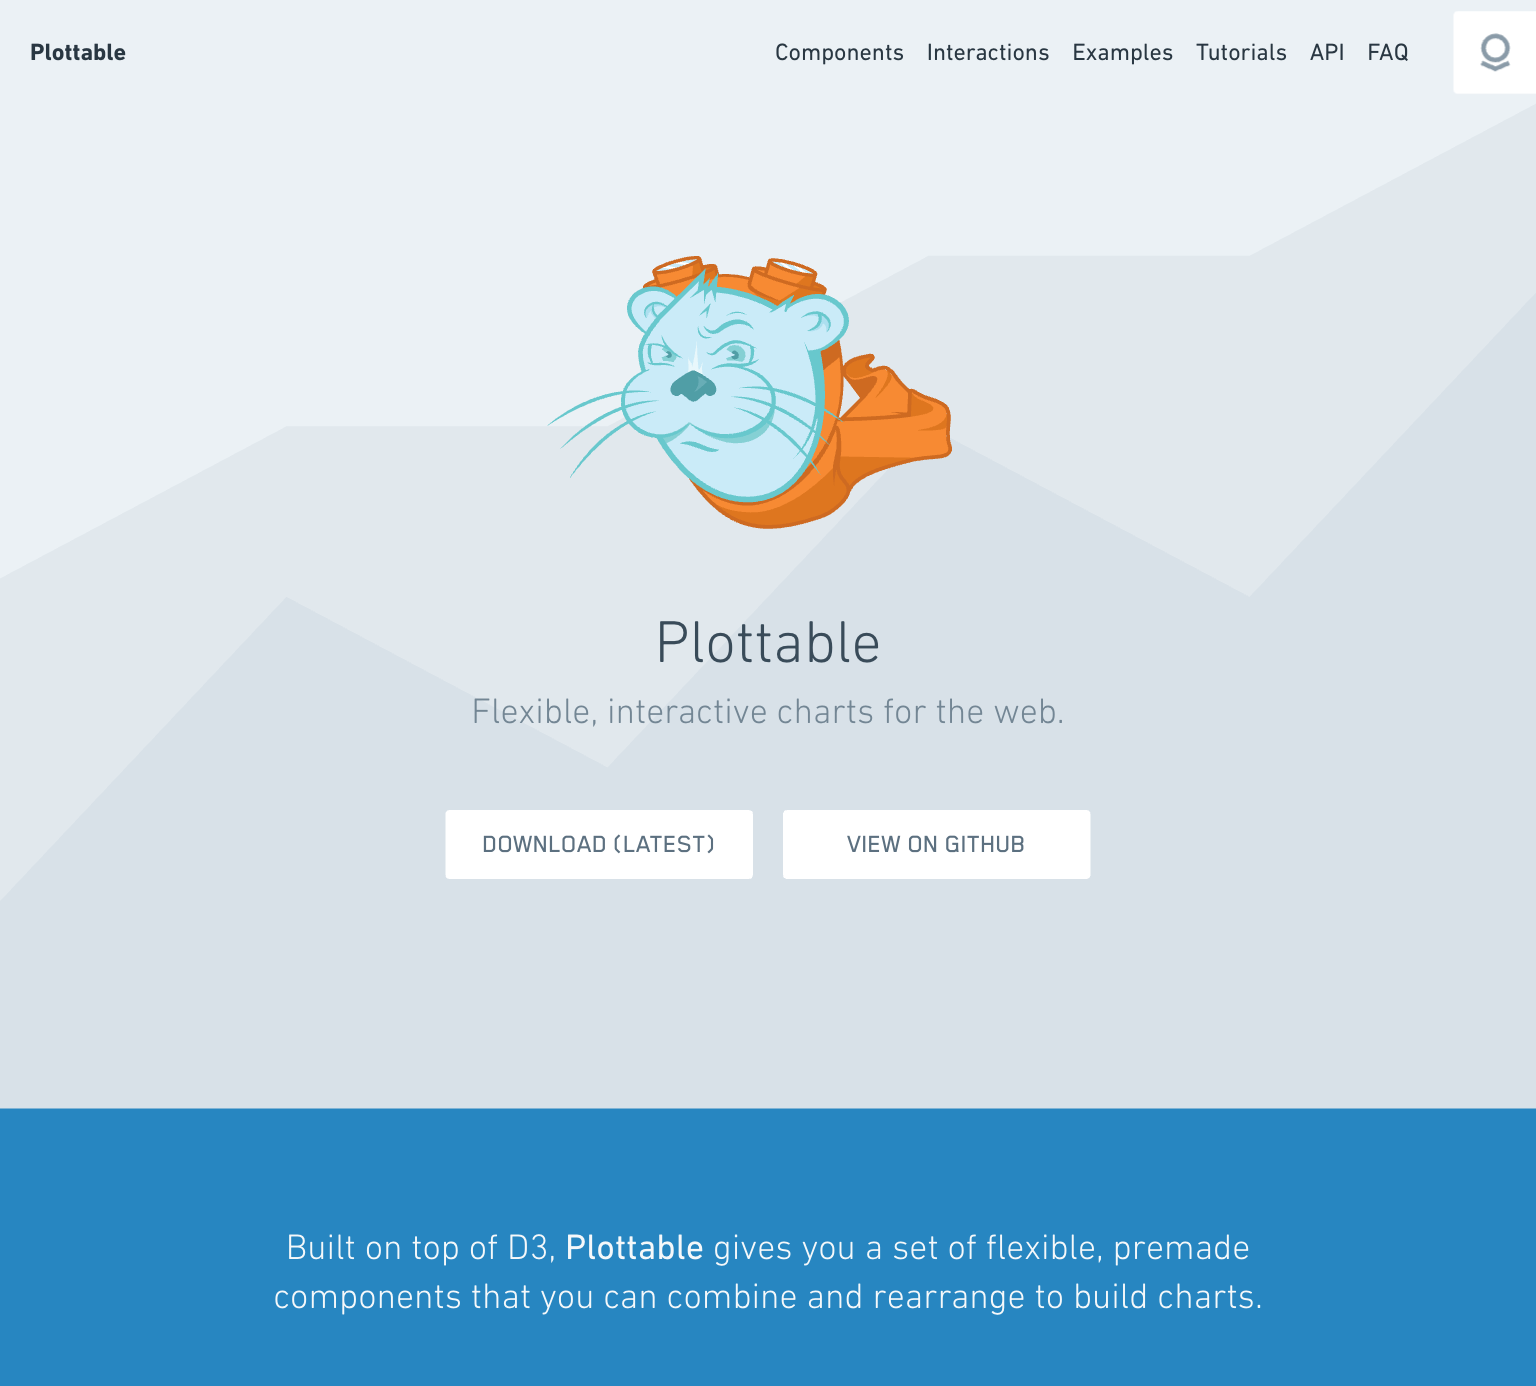
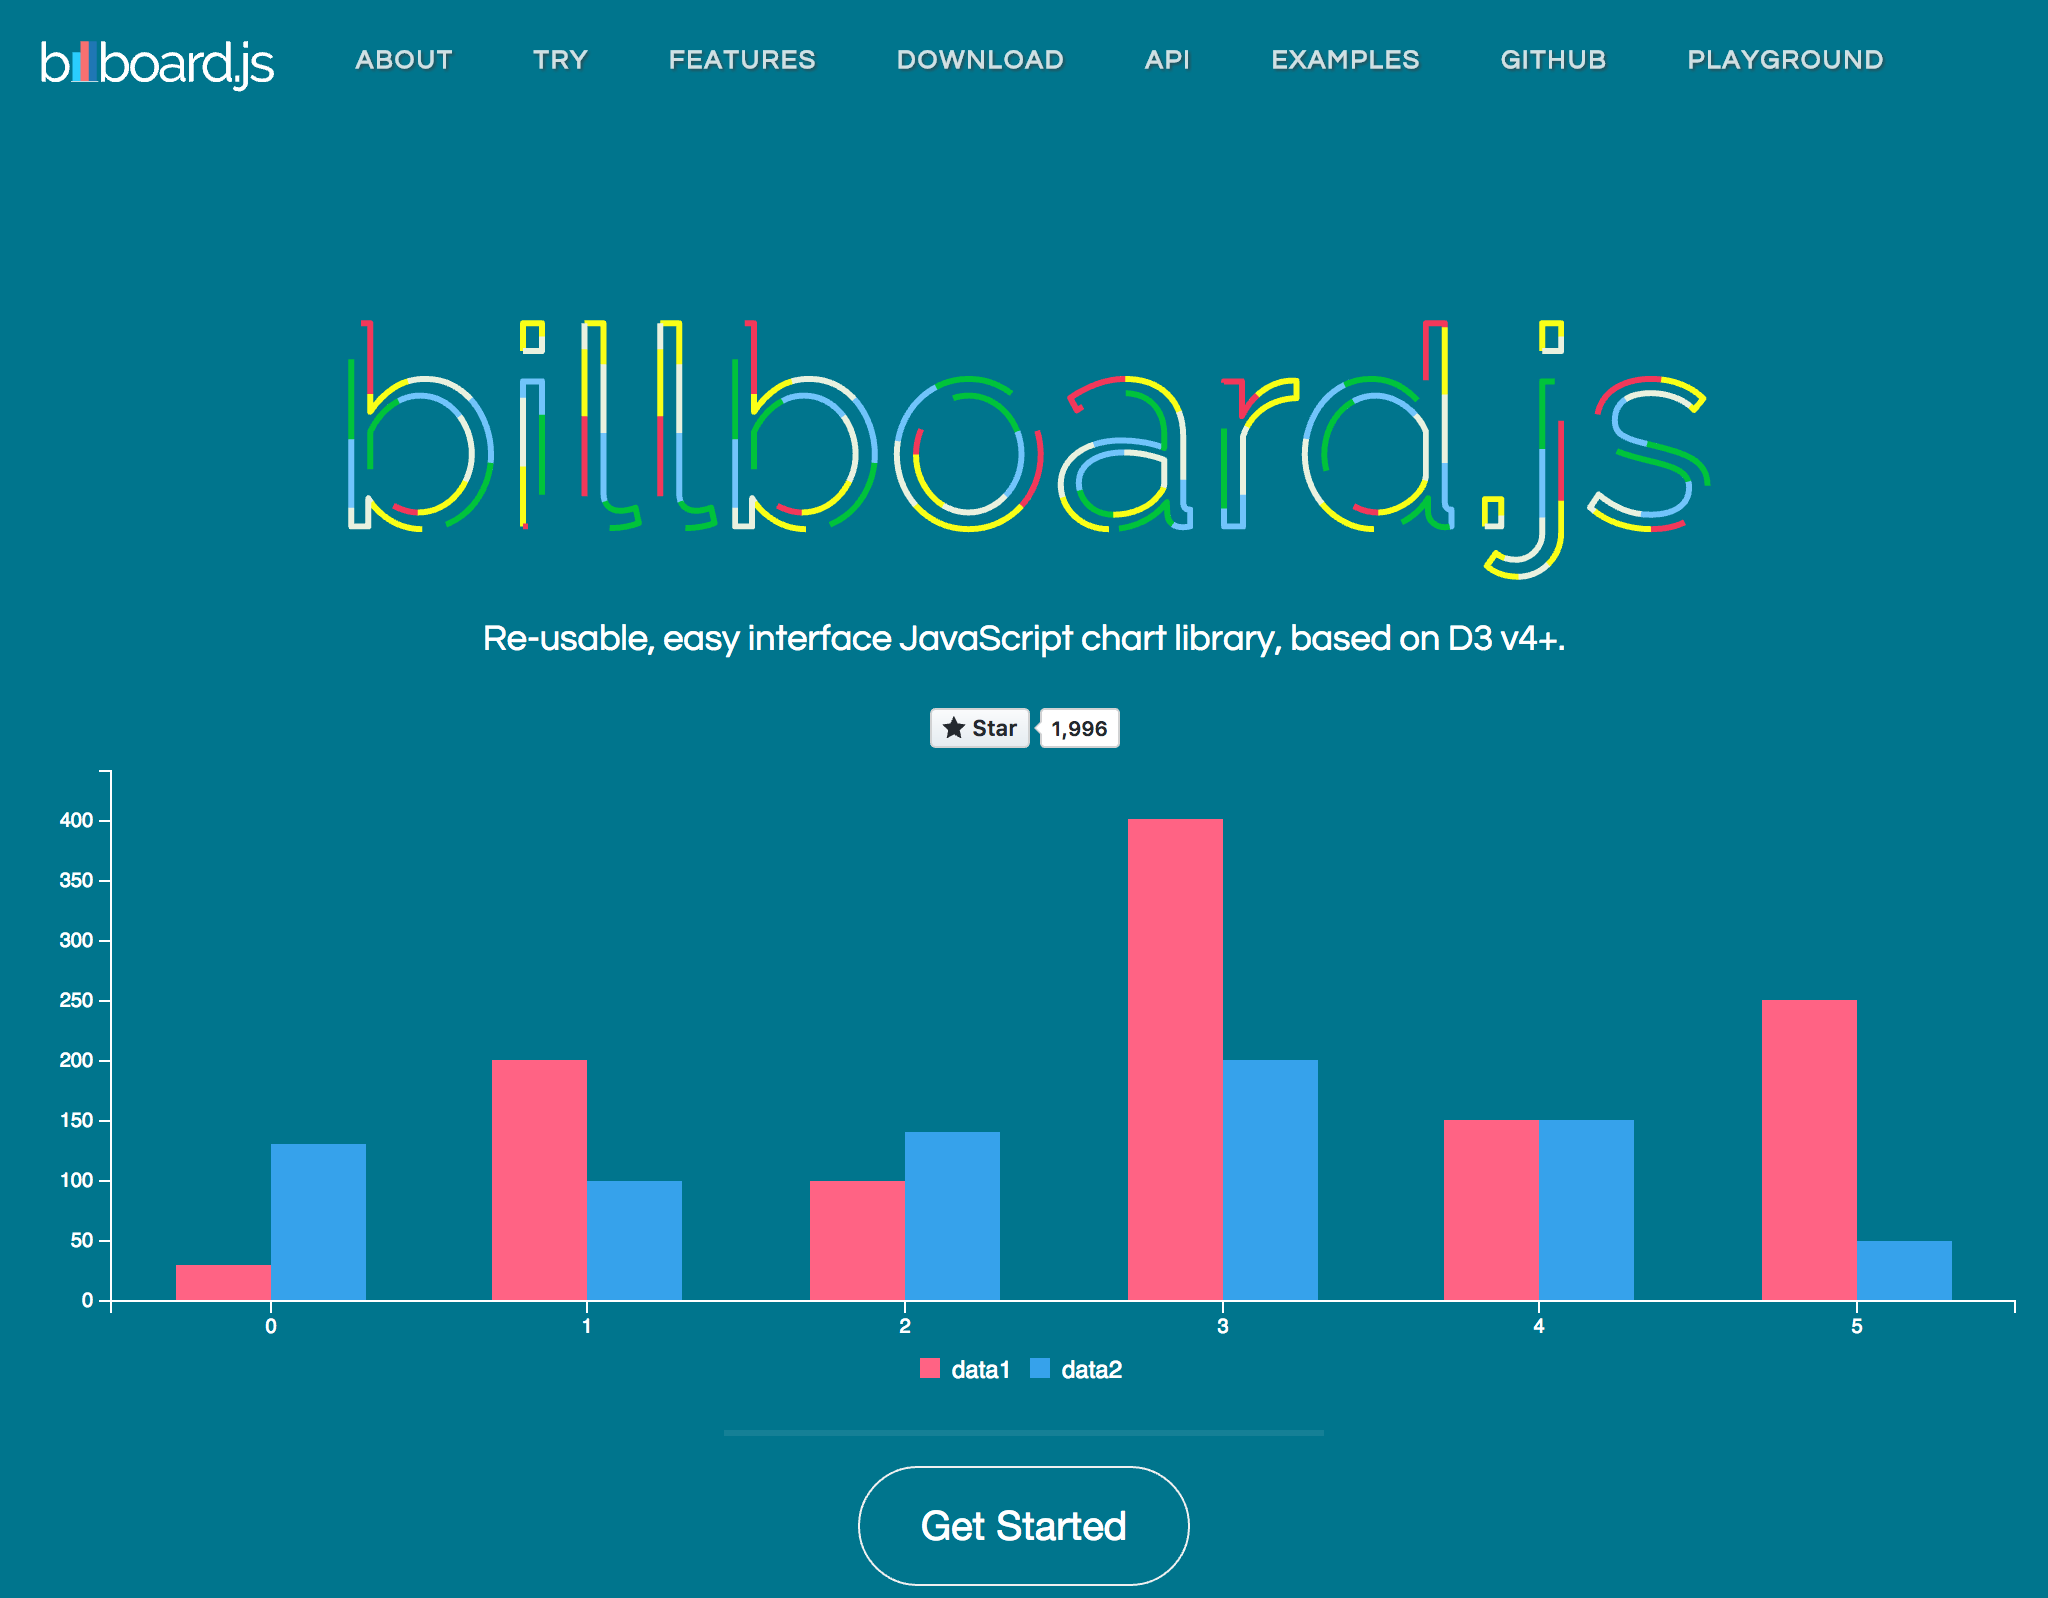
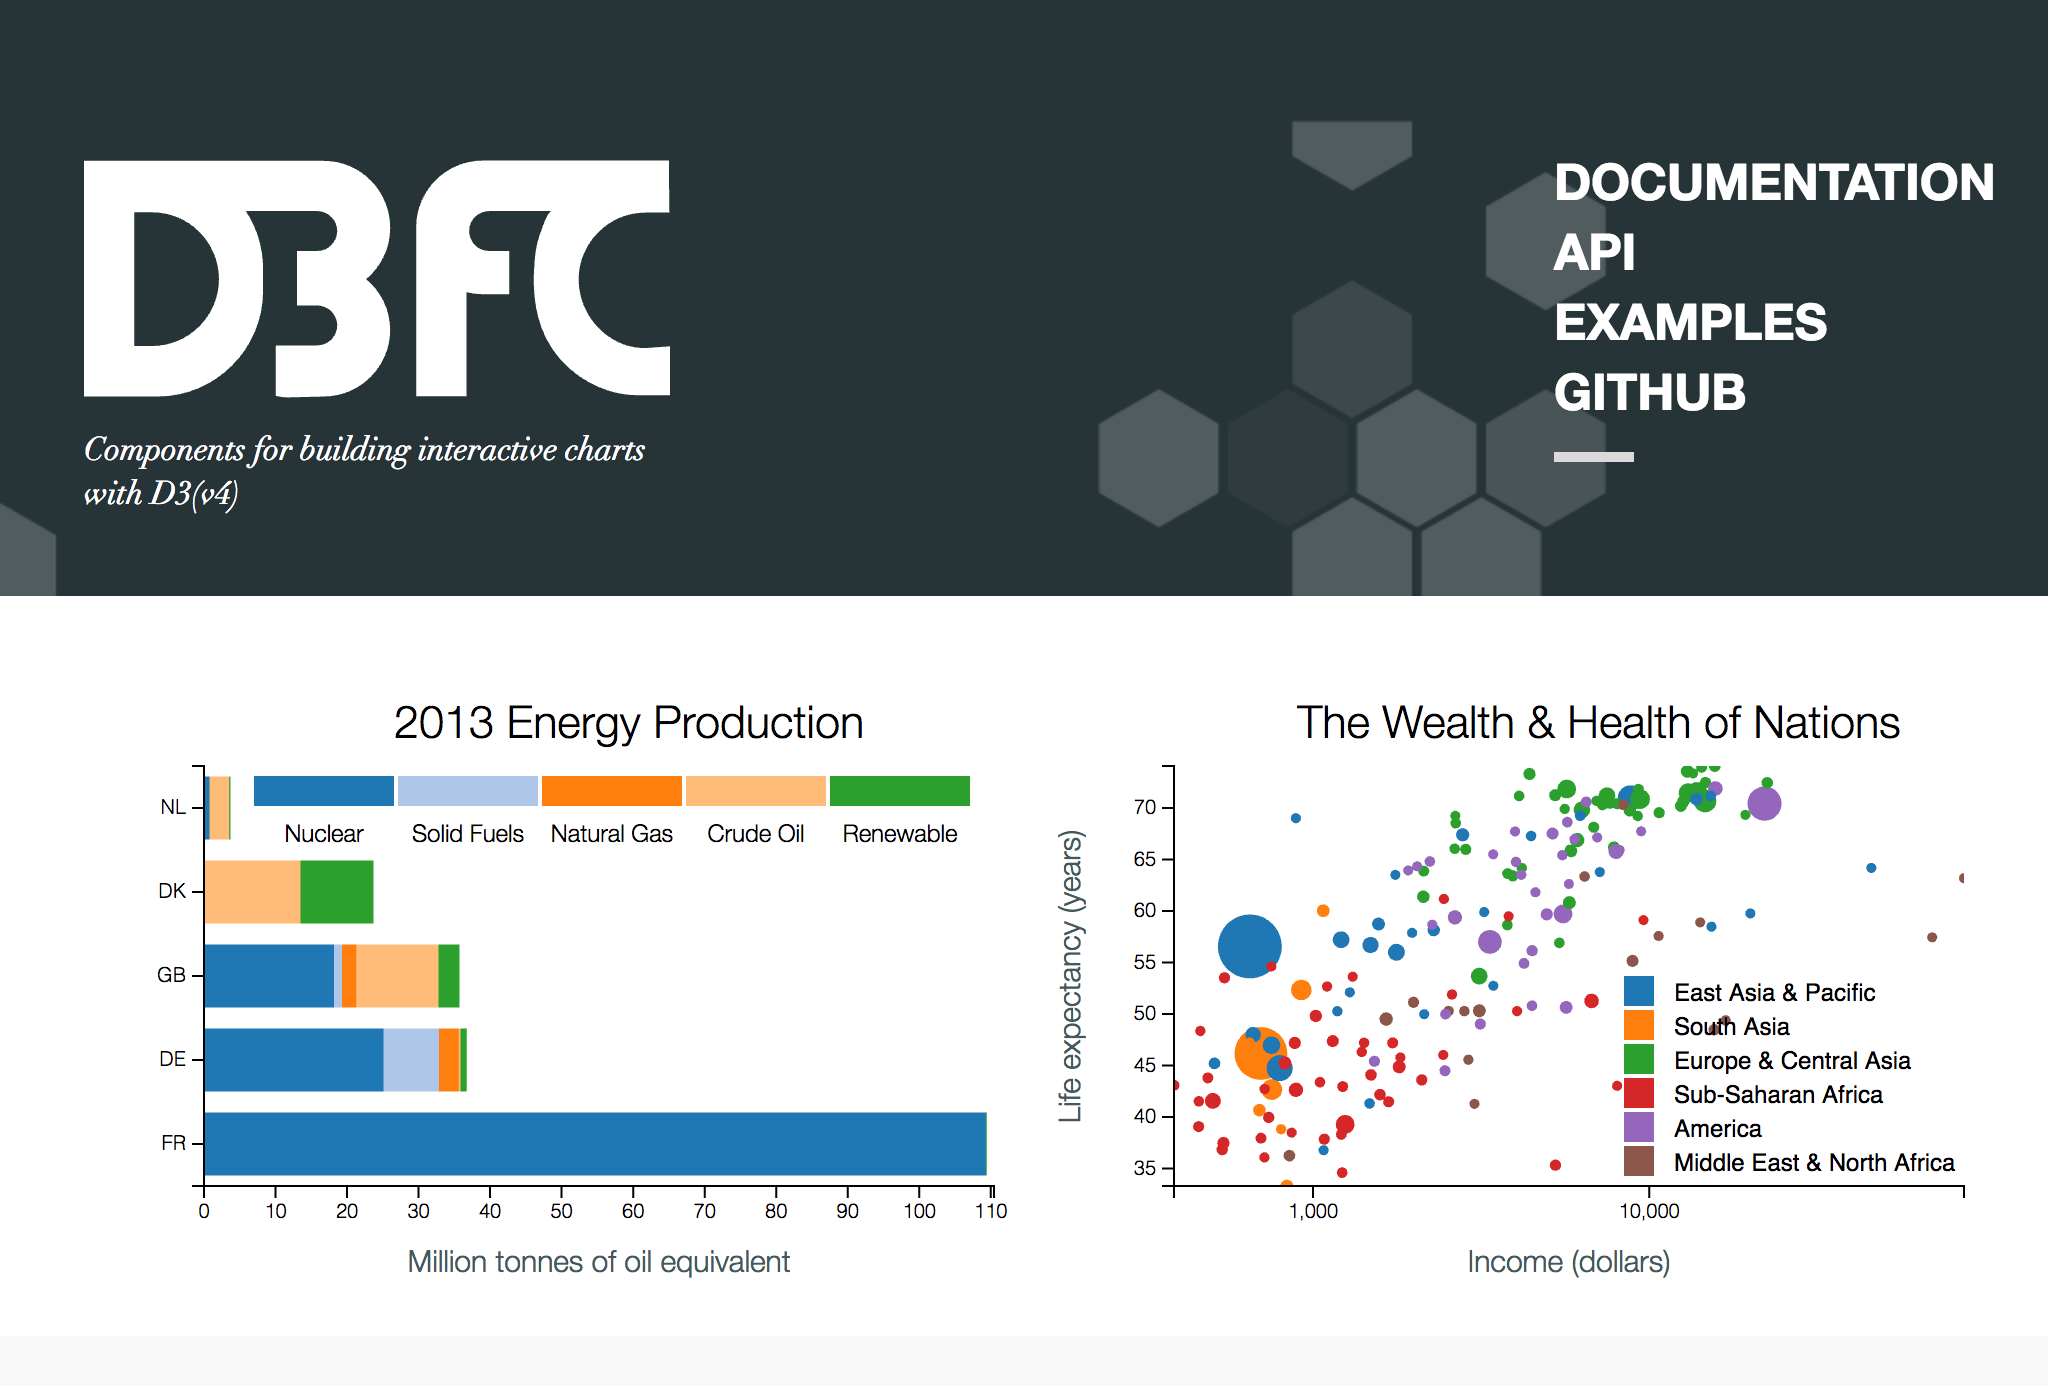
D3 Libraries


What is ReactJS?
- User Interface library
- Component-based
- Fast and efficient
Reconciliation and Rendering
- The "Renderer" and the "Reconciler" are separated
- Render in Web, Native Apps and Virtual Reality
React 16 (Fiber)
- New reconciliation algorithm
- From batching DOM operations, now React can...
- Prioritize tasks
- Split into chunks and schedule
- Parallelize operations
React Dynamic Child Components
React Dynamic Child Components
- Unique 'key' to each child component rendered
- More efficient rendering
- Similar to D3's data joins
Commonalities
- Help us with the DOM
- Love pure functions
Challenges
- D3 creates and transforms the DOM
- React as well, and keeps track of it
- Not meant to work together
React + D3 Approaches
D3 within React
- React renders root svg element
- D3 creates chart in componentDidUpdate
- Block chart updates with shouldComponentUpdate
D3 within React
class Line extends React.Component {
    componentDidMount() {
        // D3 Code to create the chart
        // using this._rootNode as container
    }

    shouldComponentUpdate() {
        // Prevents component re-rendering
        return false;
    }

    render() {
        return(
            <div
                className="line-container"
                ref={this._setRef.bind(this)}
            />
        )
    }
}
D3 within React
Pros/Cons
- ✓ Works fine
- ✓ Easiest when visualization is already implemented
- ✗ Not idiomatic on React
- ✗ A bit nasty
React Faux DOM
It's a way to use existing D3 tooling but render it efficiently through React with the React ethos
D3 within React the right way
React Faux DOM
import {withFauxDOM} from 'react-faux-dom';

class Line extends React.Component {
    componentDidMount() {
        const faux = this.props.connectFauxDOM('div', 'chart');

        // D3 Code to create the chart
        // using faux as container
        d3.select(faux)
            .append('svg')
        {...}

        this.props.animateFauxDOM(800);
    }

    render() {
        <div className="line-container">
           {this.props.chart}
        </div>
    }
}

export default withFauxDOM(Line);
React Faux DOM
Pros/Cons
- ✓ Use all D3 APIs
- ✓ Good integration with already built D3
- ✓ Server Side Rendering
- ✗/✓ Need to use React Animations
- ✗ Compatibility with D3.js plugins
- ✗ Less performant (small/medium size dataviz)
Lifecycle Methods Mapping
- Lightweight React Component Wrapper
- D3-only file with create, update and unmount methods
Integrating D3.js visualizations in a React app
Lifecycle Methods Mapping
import D3Line from './D3Line'

class Line extends React.Component {
    componentDidMount() {
        // D3 Code to create the chart
        this._chart = D3Line.create(
            this._rootNode,
            this.props.data,
            this.props.config
        );
    }

    componentDidUpdate() {
        // D3 Code to update the chart
        D3Line.update(
           this._rootNode,
           this.props.data,
           this.props.config,
           this._chart
        );
    }

    componentWillUnmount() {
        D3Line.destroy(this._rootNode);
    }

    _setRef(componentNode) {
        this._rootNode = componentNode;
    }

    render() {
        <div
            className="line-container"
            ref={this._setRef.bind(this)}
        />
    }
}
Lifecycle Methods Mapping - D3Line
const D3Line = {};

D3Line.create = (el, data, configuration) => {
    // D3 Code to create the chart
};

D3Line.update = (el, data, configuration, chart) => {
    // D3 Code to update the chart
};

D3Line.destroy = () => {
    // Cleaning code here
};

export default D3Line;
Lifecycle Methods Mapping
Pros/Cons
- ✓ Separation of concerns
- ✓ Easy to integrate D3.js code
- ✓ Flexible, could encapsulate any chart
- ✗/✓ Adds another file
D3 for the Math,
React for the DOM
- D3 is used for math and formats
- React rules the DOM
## D3 sub-modules: DOM Related
* [Selections (d3-selection)](https://github.com/d3/d3-selection)
* [Transitions (d3-transition)](https://github.com/d3/d3-transition)
* [Axes (d3-axis)](https://github.com/d3/d3-axis)
* [Zooming (d3-zoom)](https://github.com/d3/d3-zoom)
* [Dragging (d3-drag)](https://github.com/d3/d3-drag)
* [Brushes (d3-brush)](https://github.com/d3/d3-brush)
* [Geographies (d3-geo)](https://github.com/d3/d3-geo)
* [Shapes (d3-shape)](https://github.com/d3/d3-shape)
Note:
* Selections OK
* Animations with multiple libraries
* The rest, DIY
D3 for the Math,
React for the DOM
class Line extends React.Component {
    drawLine() {
        let xScale = d3.scaleTime()
            .domain(d3.extent(
                this.props.data,
                ({date}) => date
            ))
            .rangeRound([0, this.props.width]);

        let yScale = d3.scaleLinear()
            .domain(d3.extent(
                this.props.data,
                ({value}) => value
            ))
            .rangeRound([this.props.height, 0]);

        let line = d3.line()
            .x((d) => xScale(d.date))
            .y((d) => yScale(d.value));

        return (
            <path
                className="line"
                d={line(this.props.data)}
            />
        );
    }

    render() {
        <svg
           className="line-container"
           width={this.props.width}
           height={this.props.height}
        >
           {this.drawLine()}
        </svg>
    }
}
D3 for the Math,
React for the DOM
Pros/Cons
- ✓ Consistent with the React way
- ✗ A lot of work upfront
- ✗ D3 Reimplementation of certain parts
- ✗ Limited to SVG rendering
 Reference
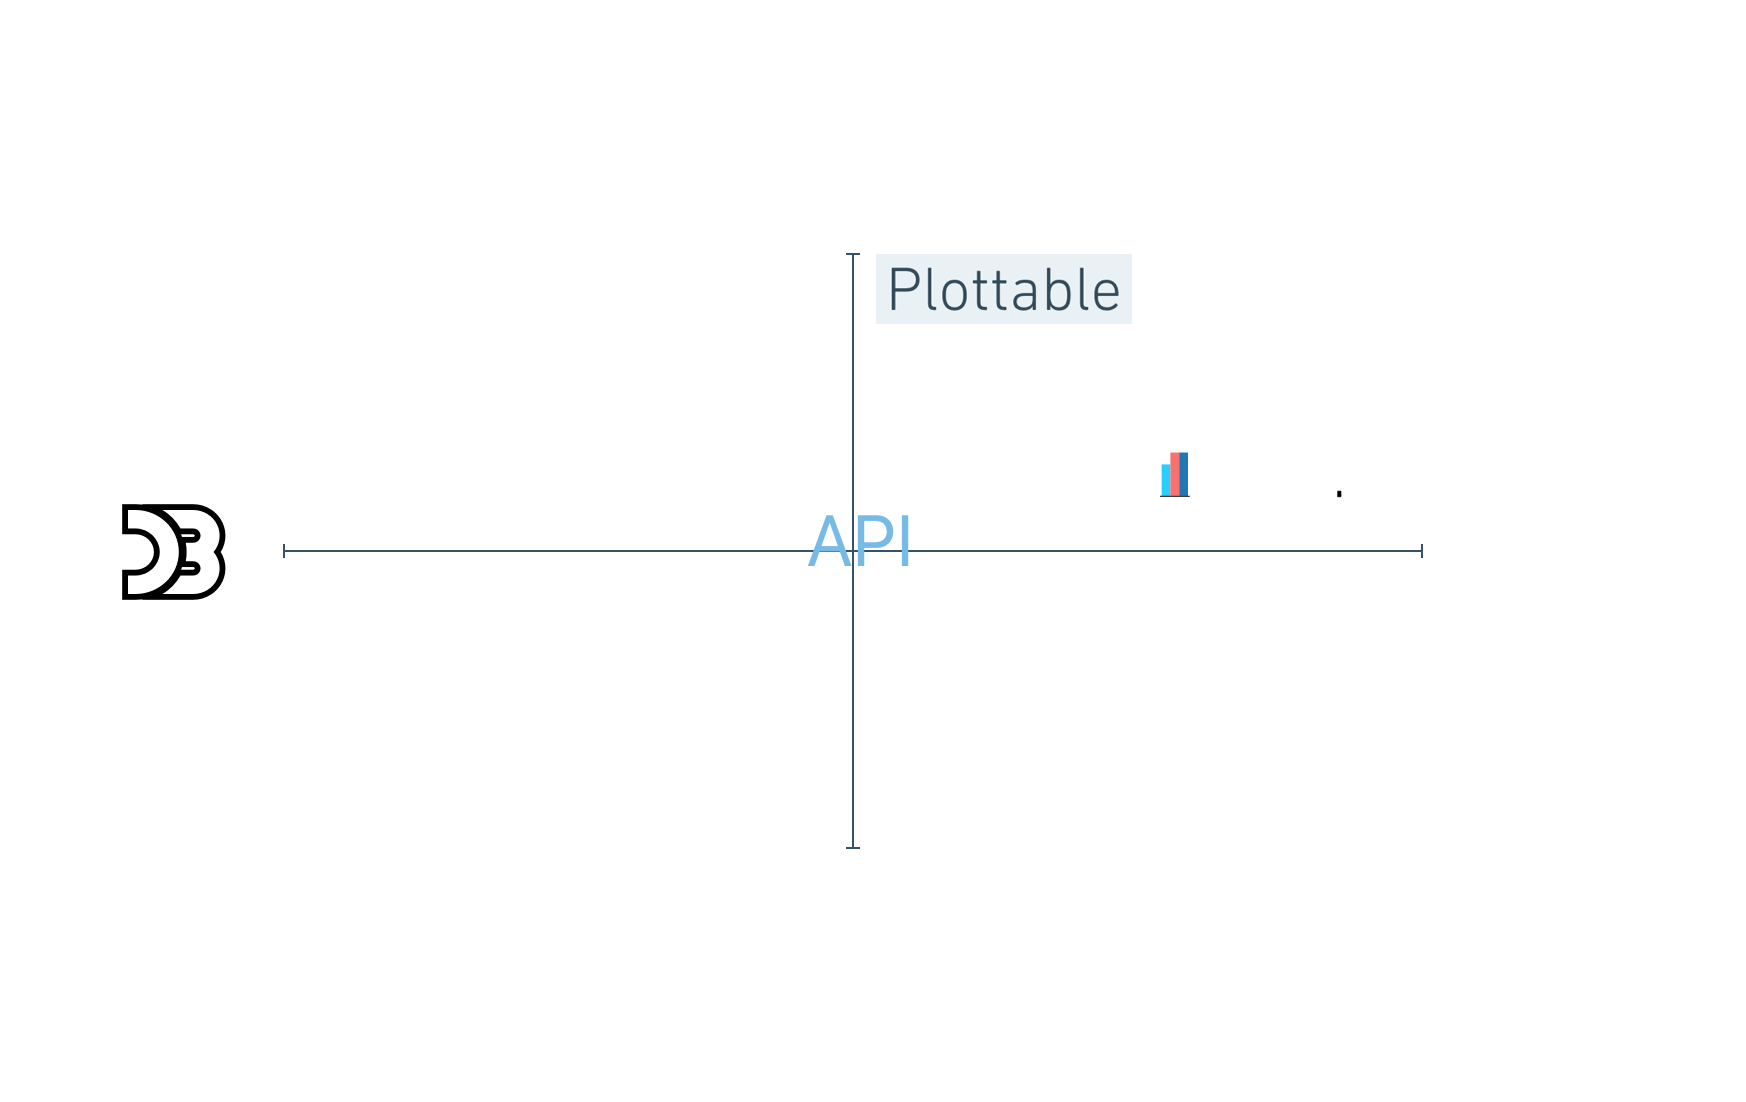
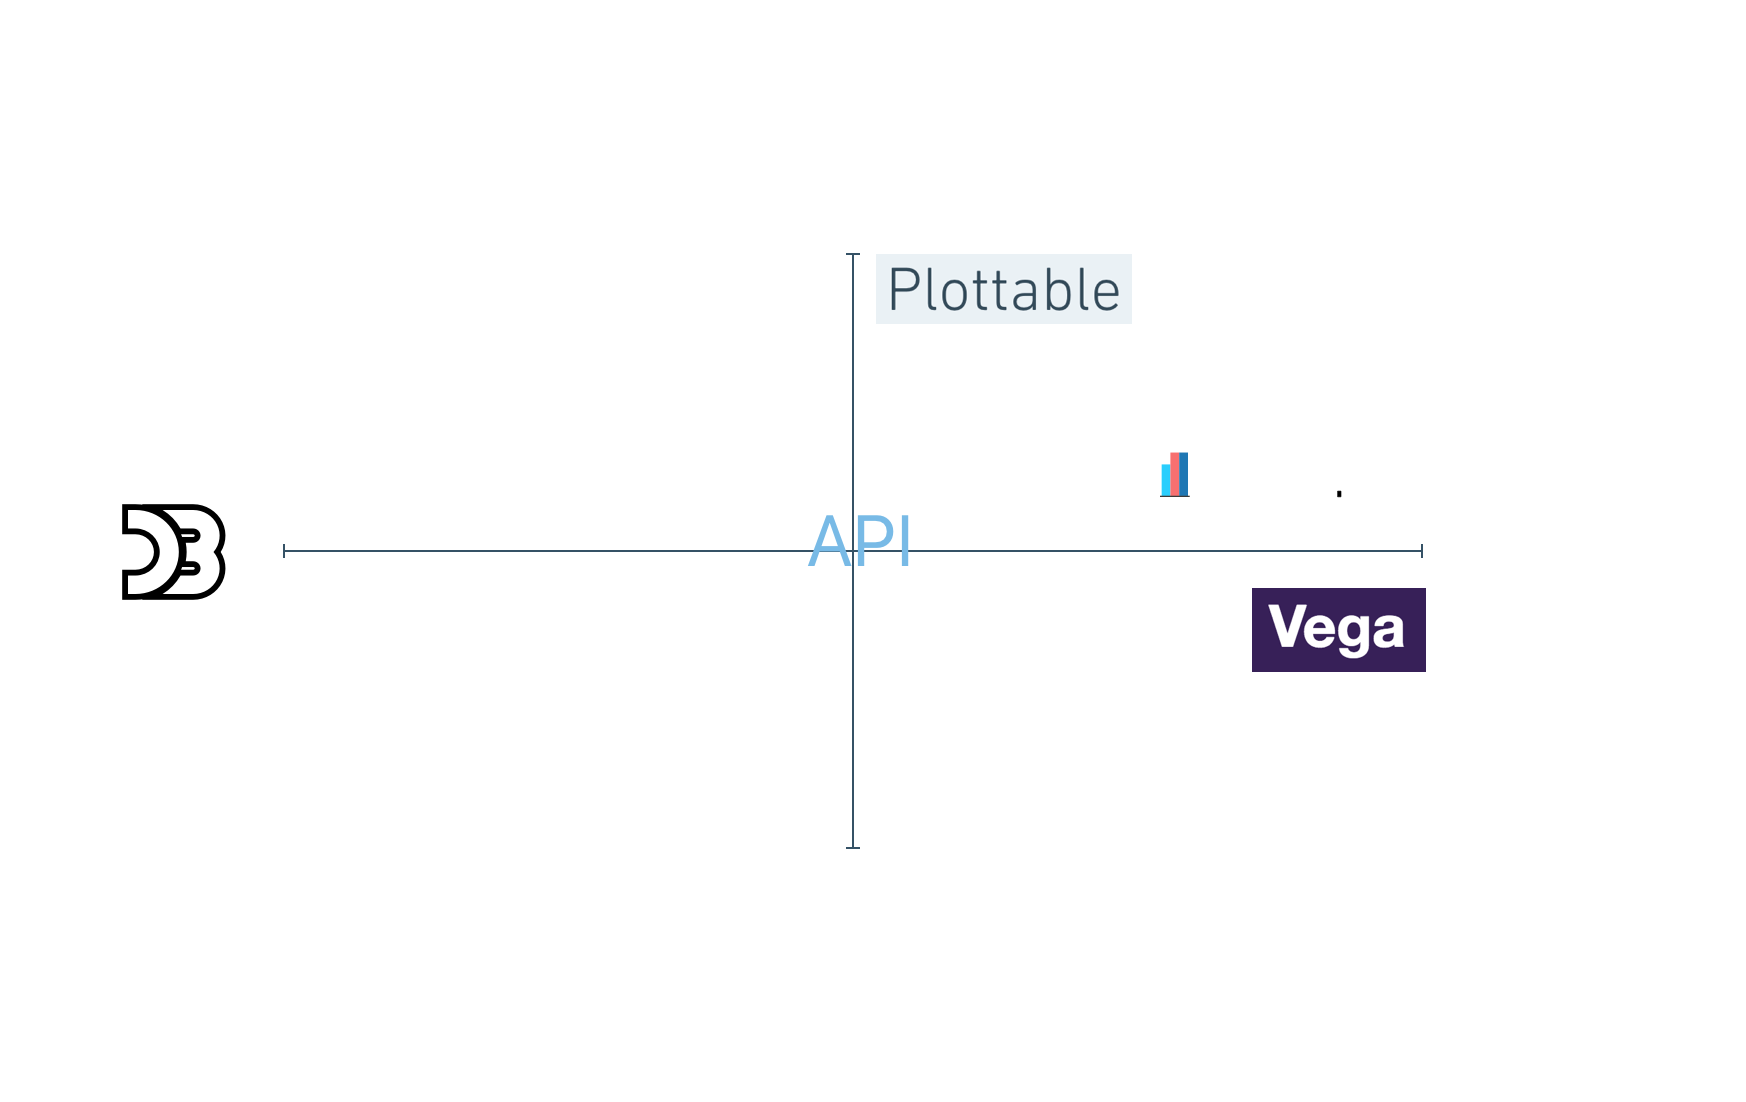
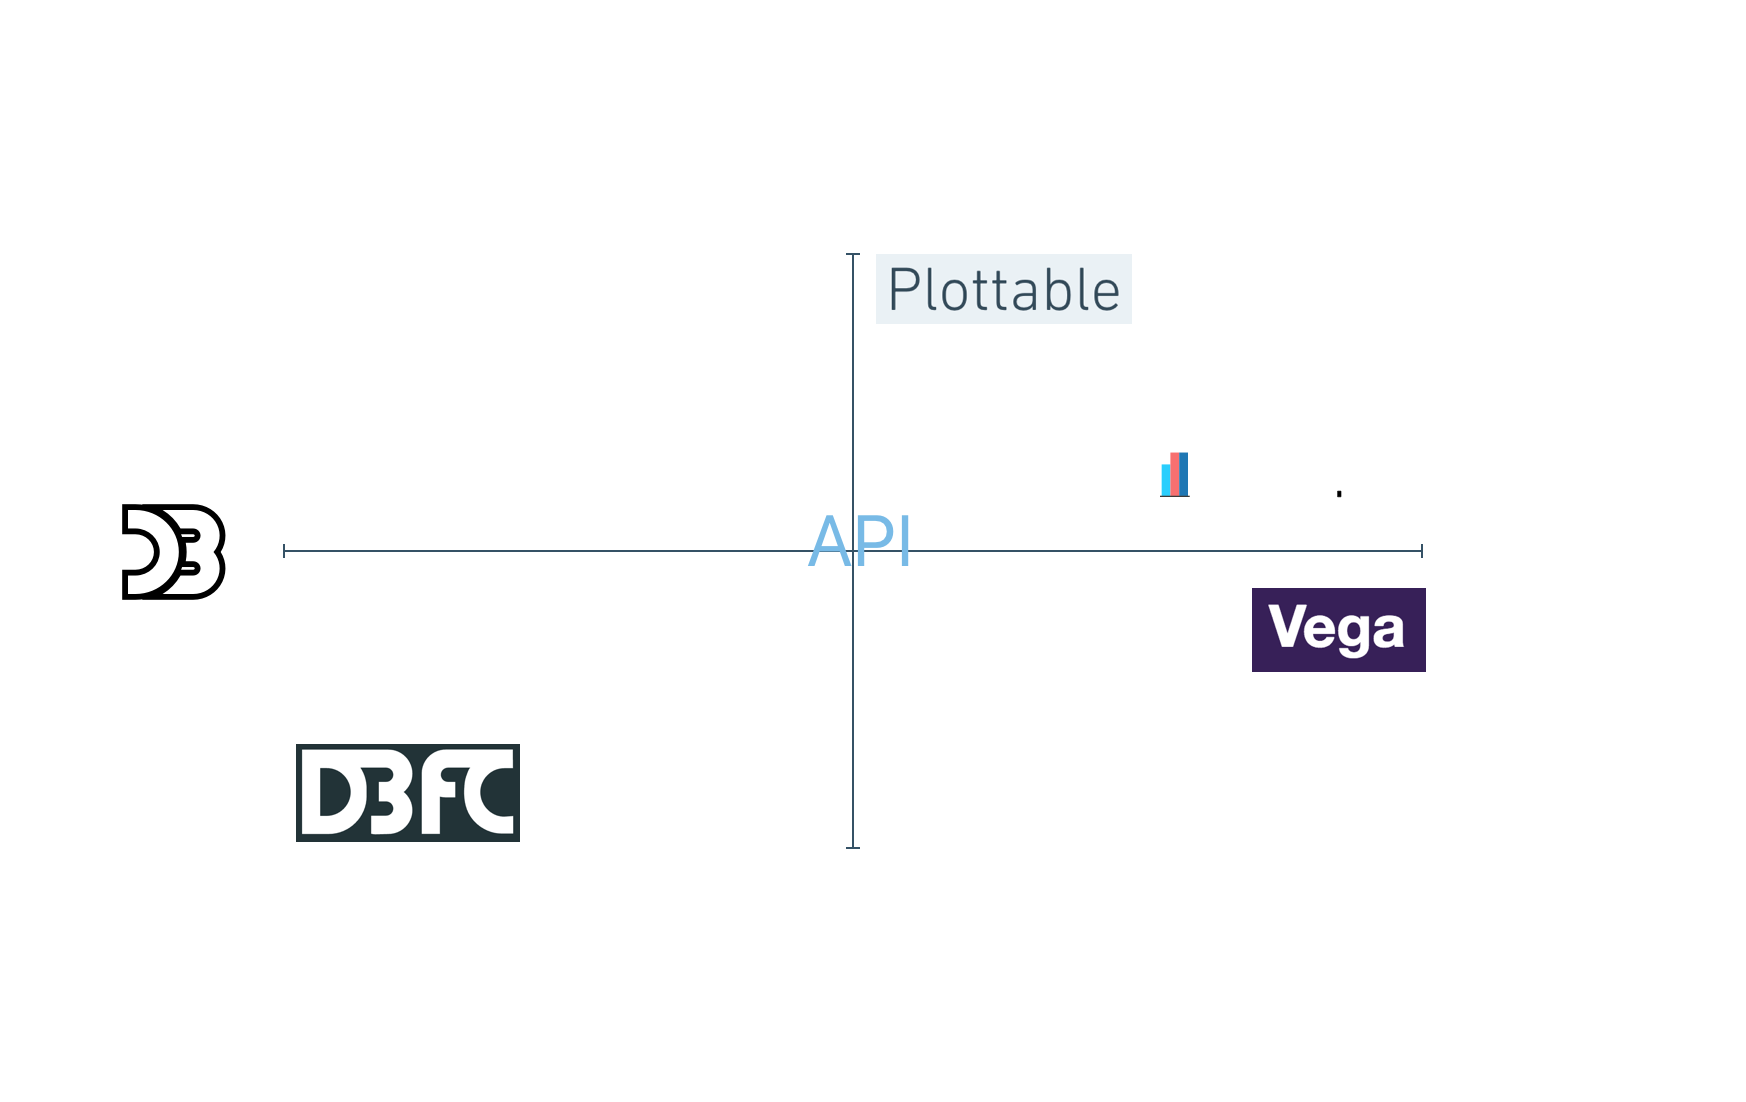
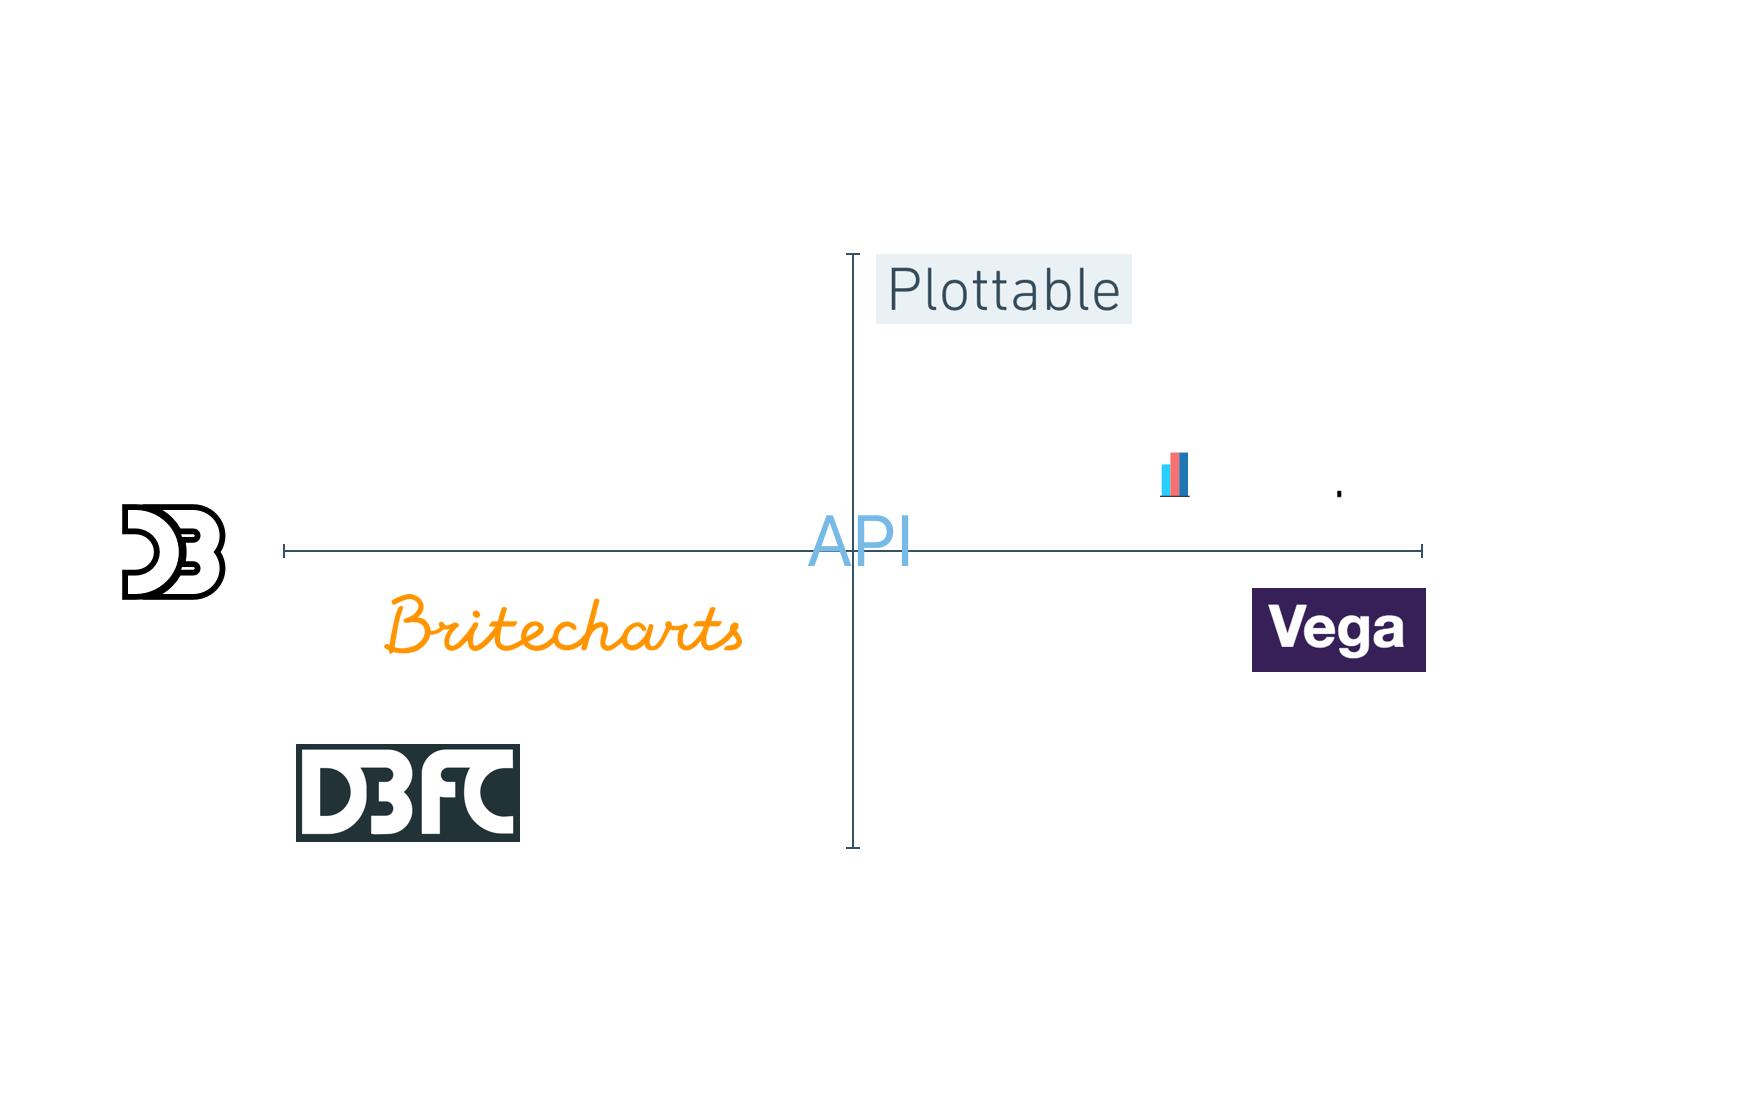
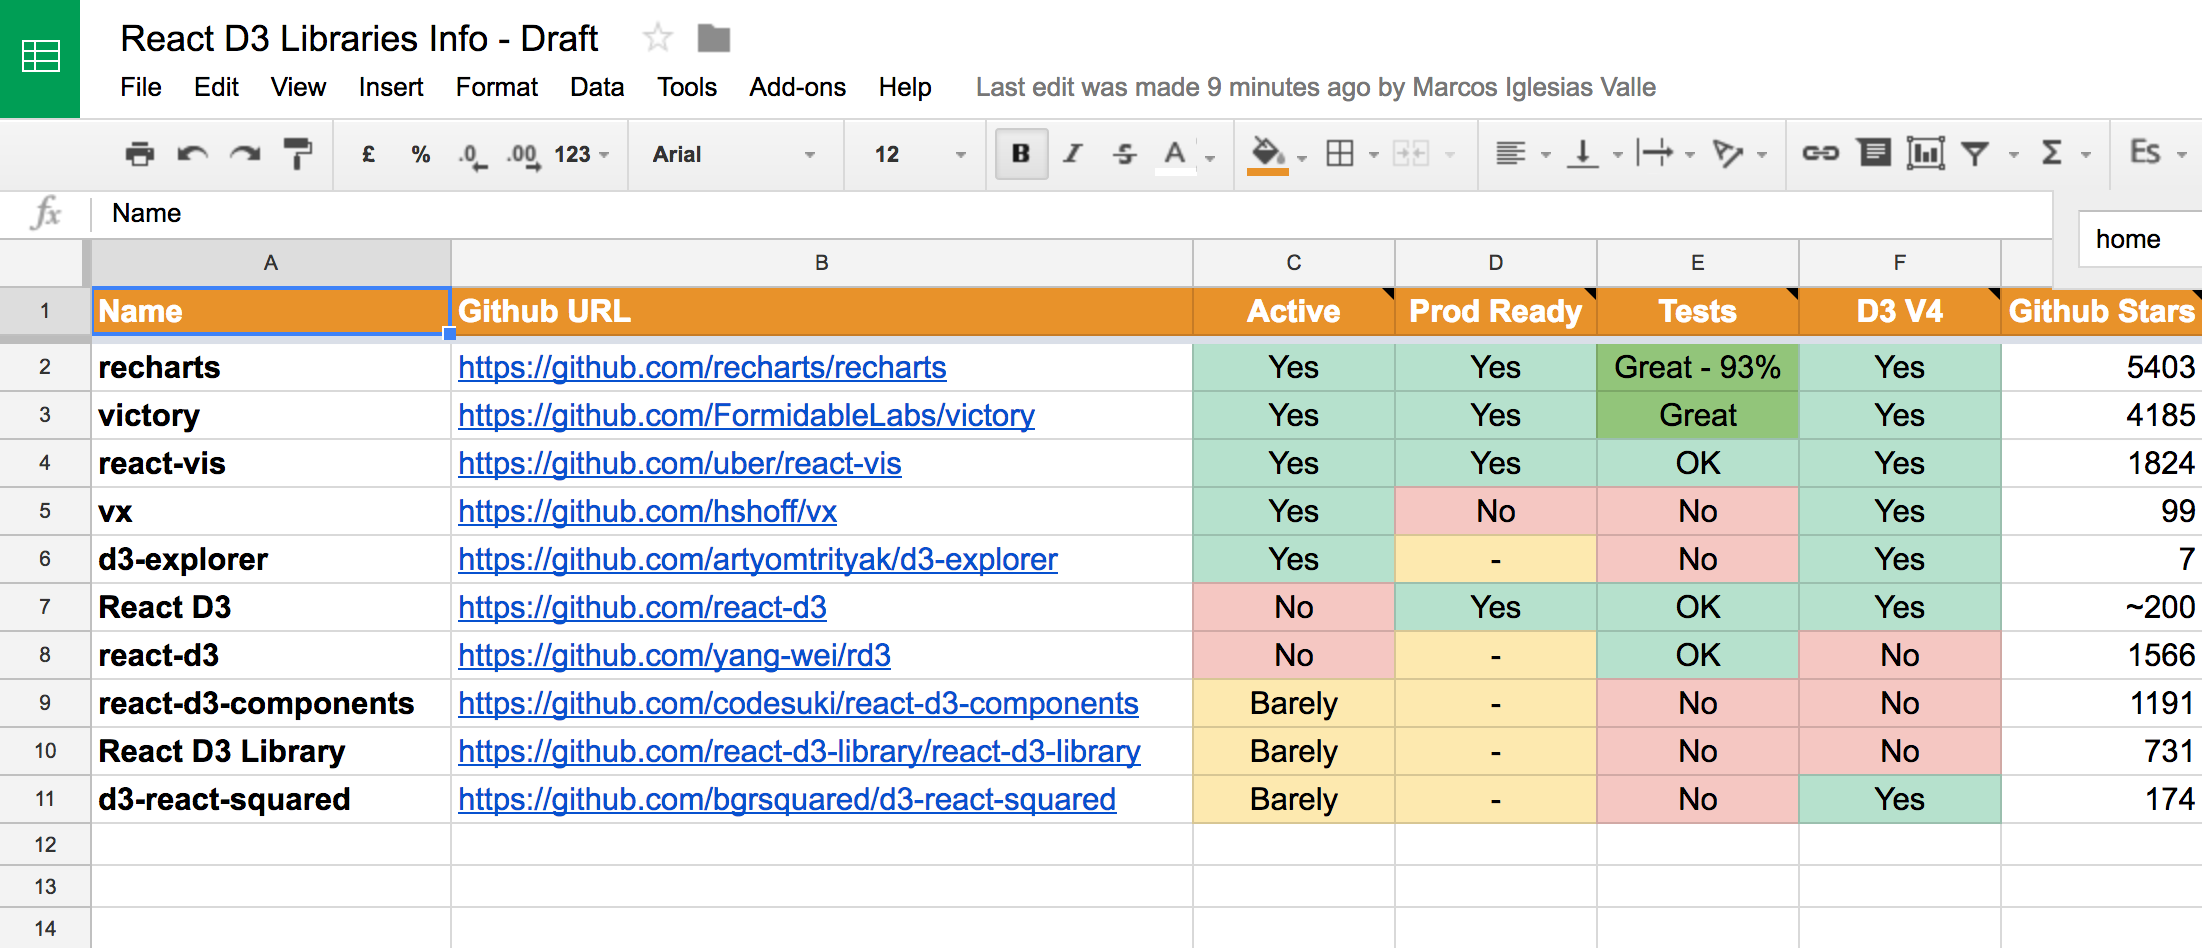
React + D3 Libraries
Ecosystem
- Non-maintained libraries
- Not easy to keep up with D3 and React
- D3 v4 cleaned up the field

Linechart Code
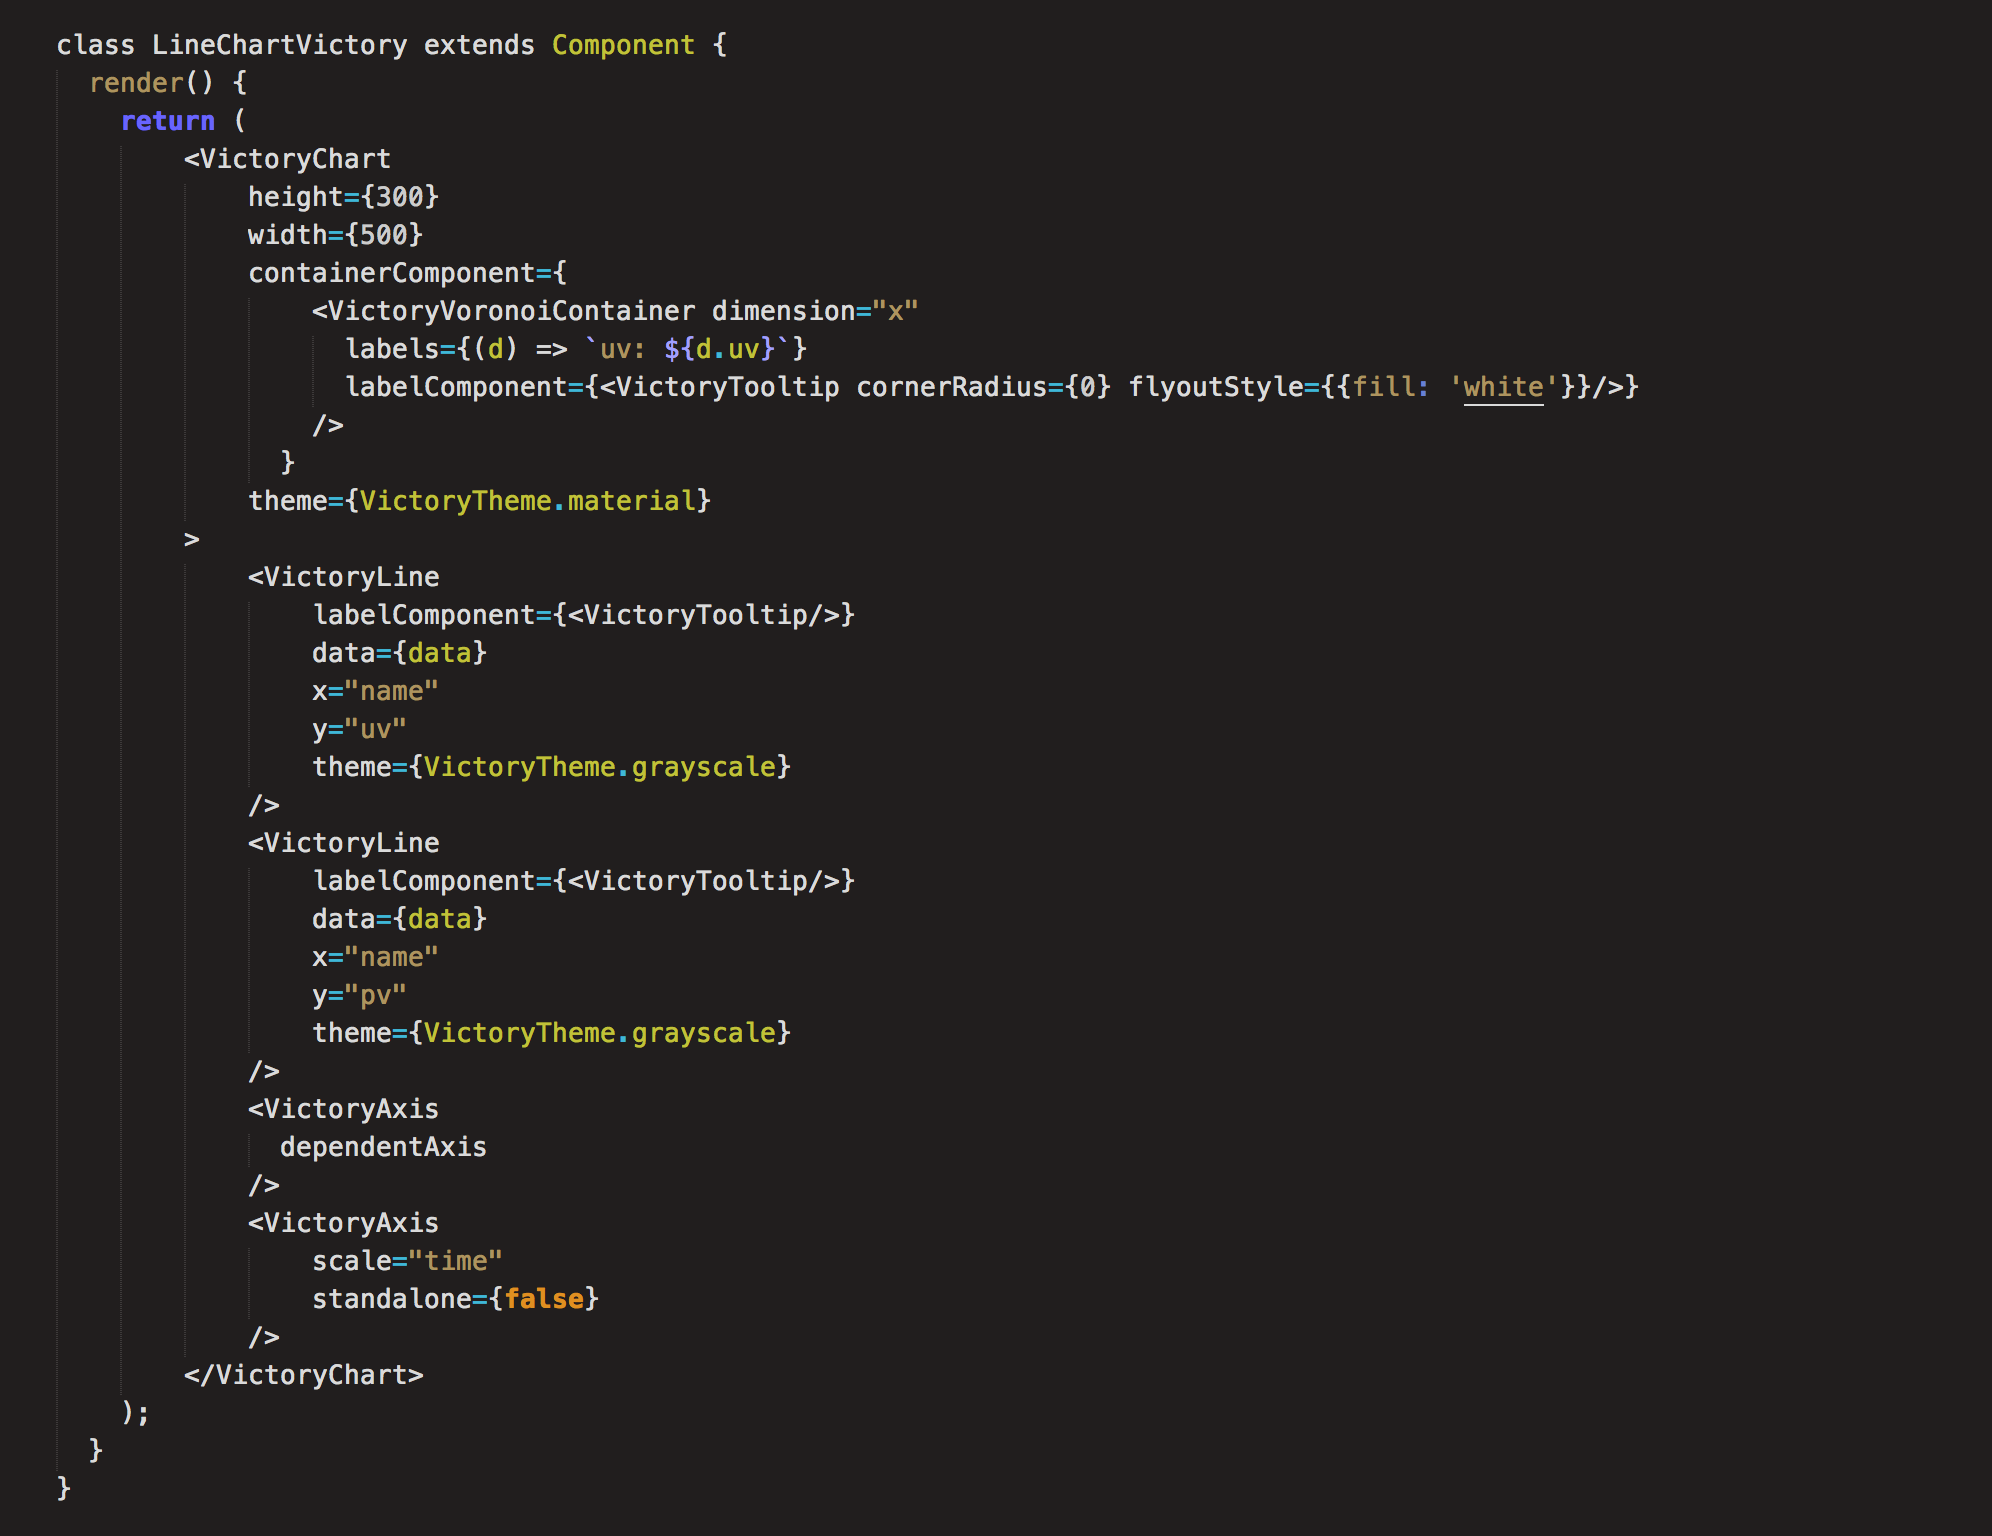
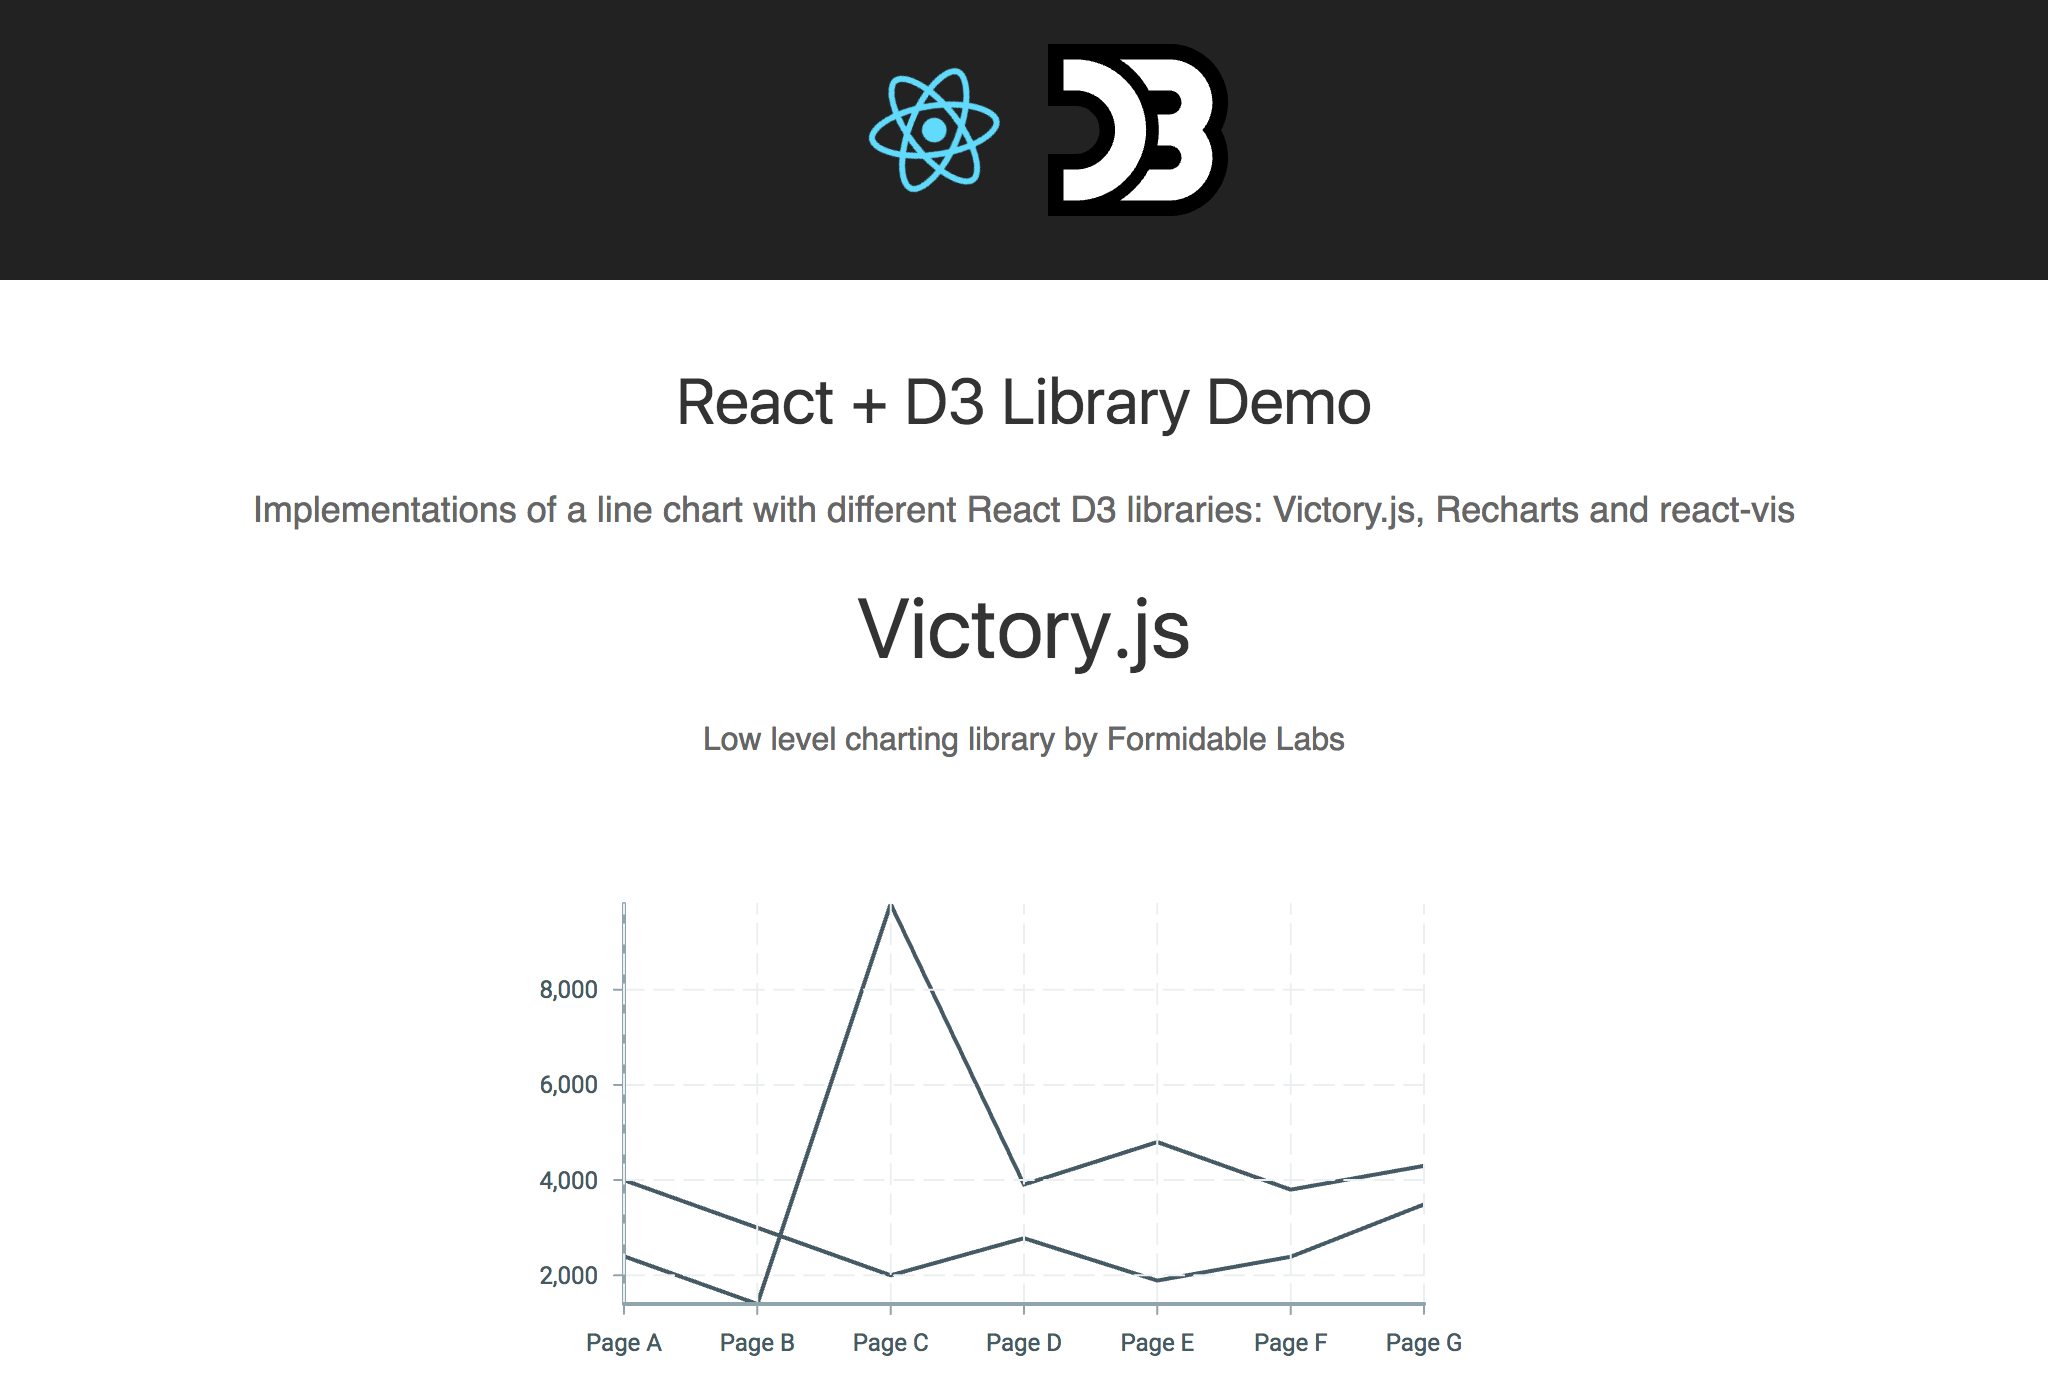
VictoryJS
- Easy to get started
- Zoom and Voronoi
- React Native option
Linechart Code
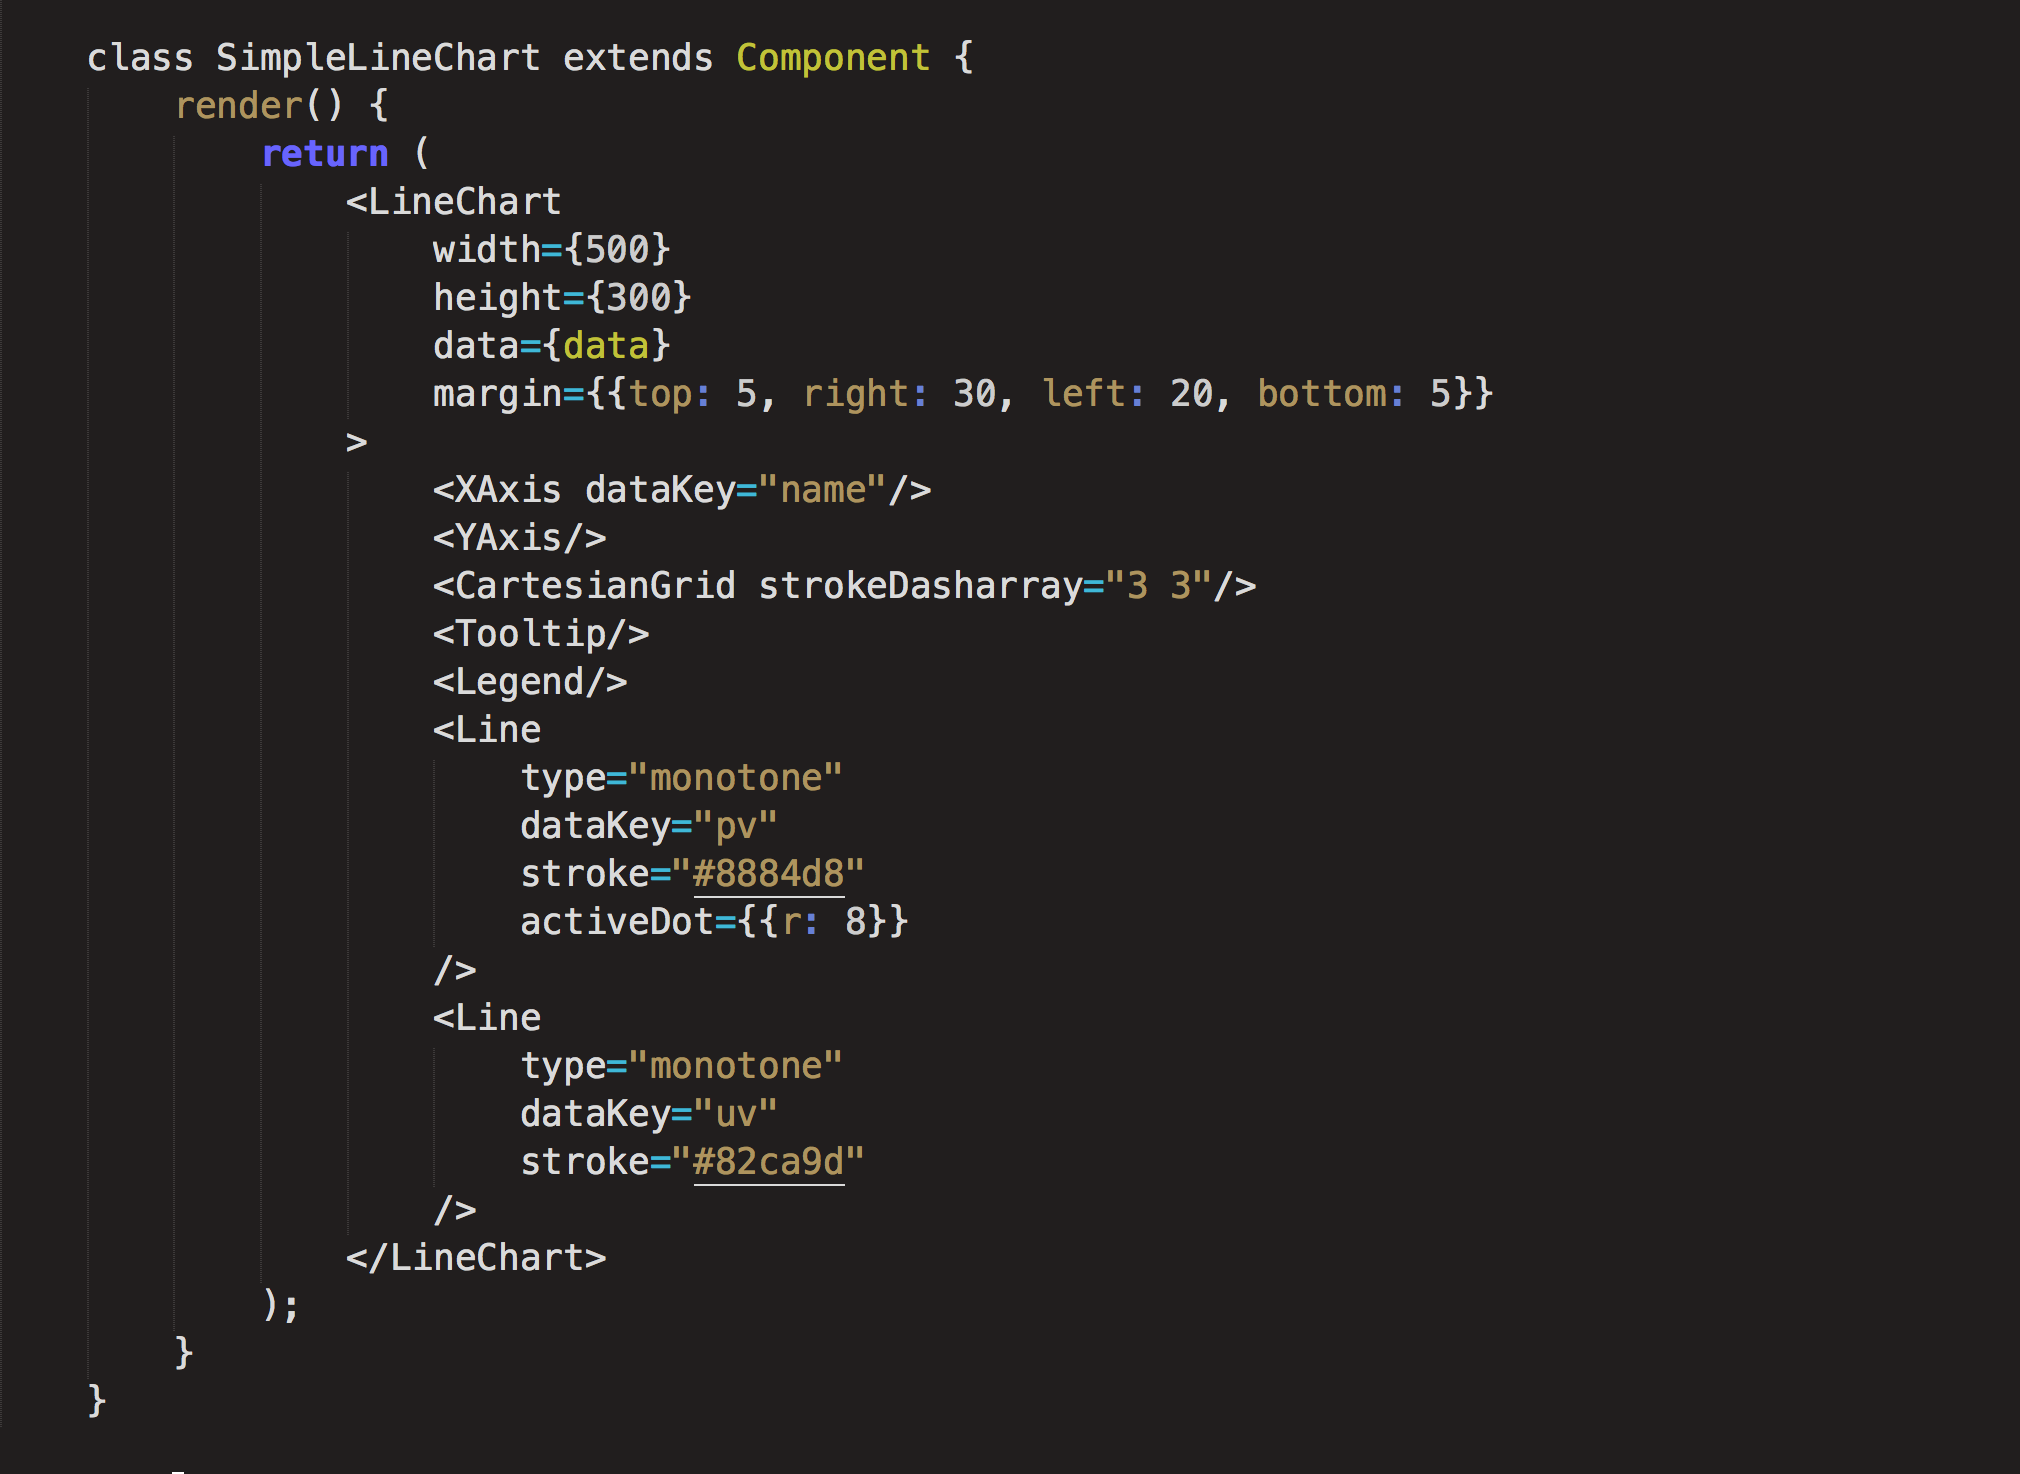
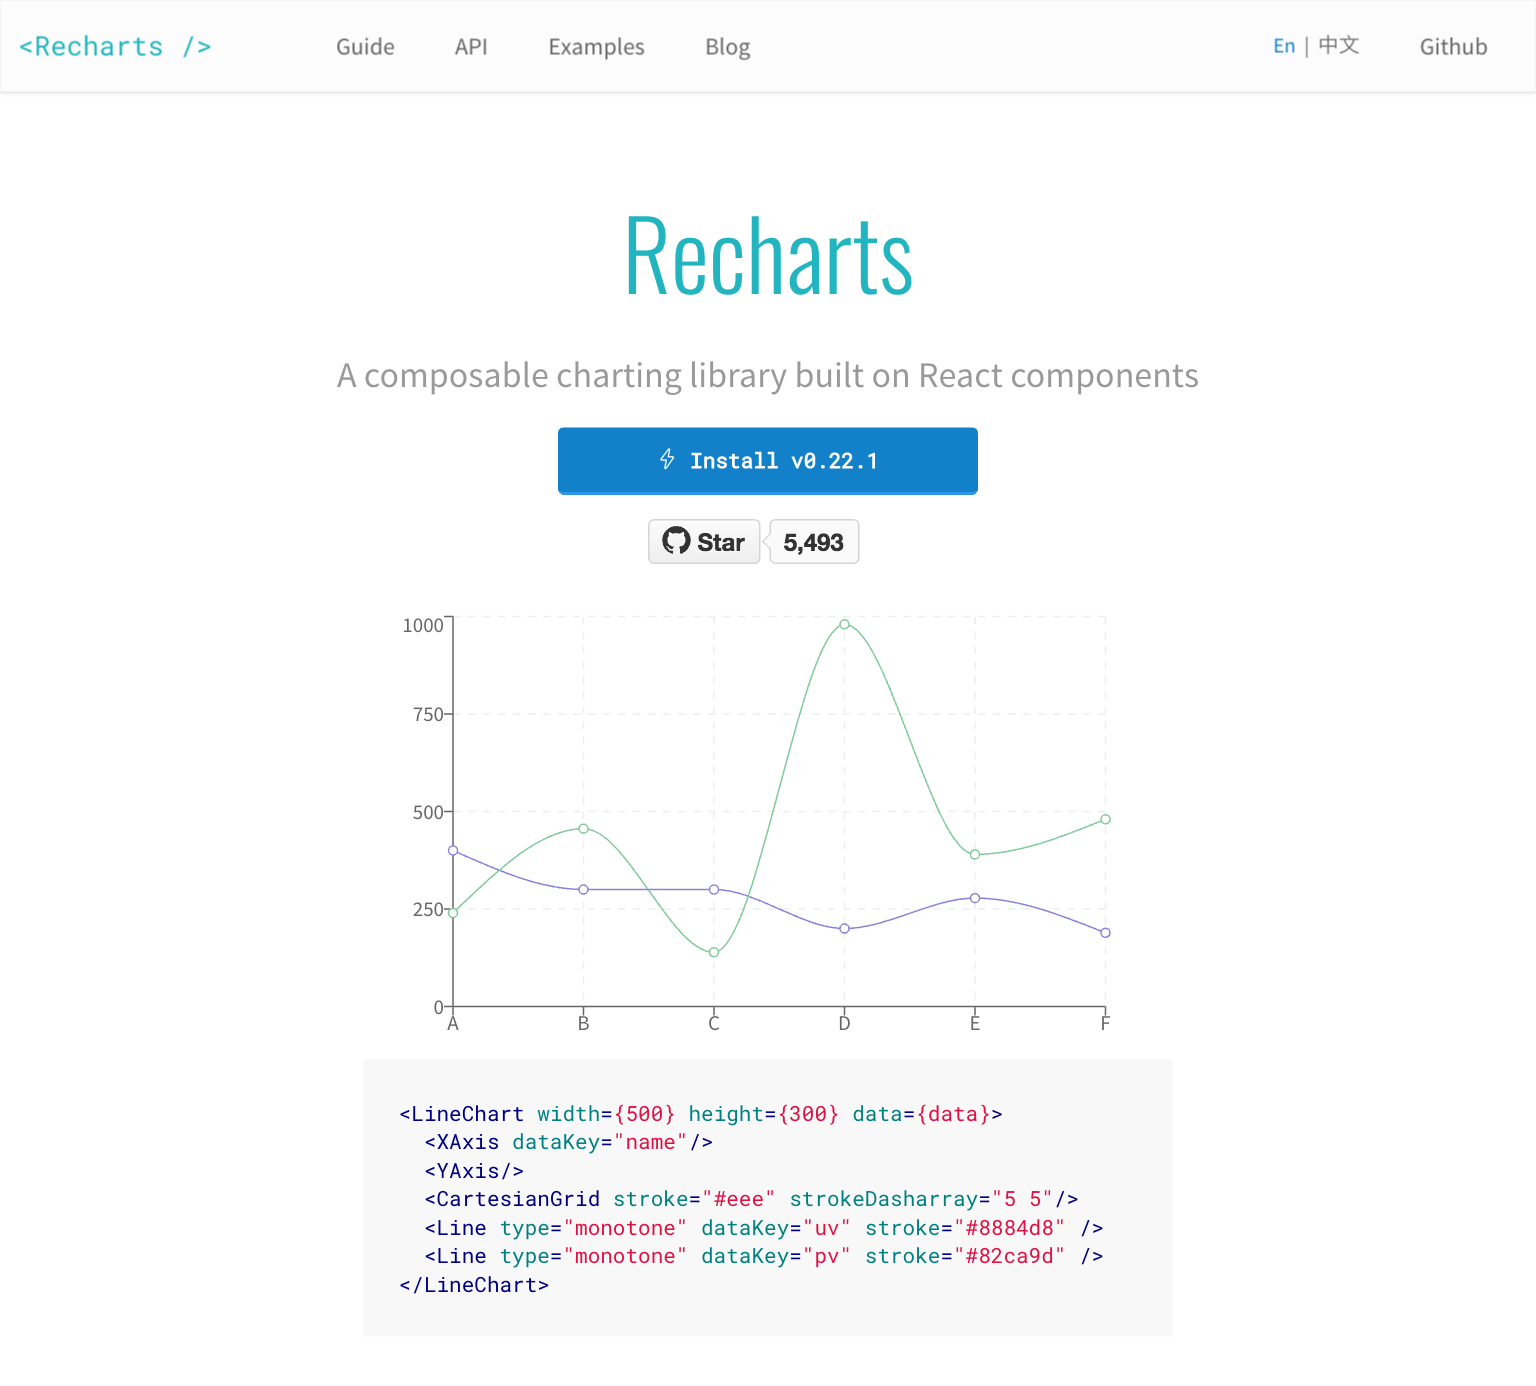
Recharts
- Really well tested
- Charts plus legend, tooltip and brush
- Great docs
Linechart Code
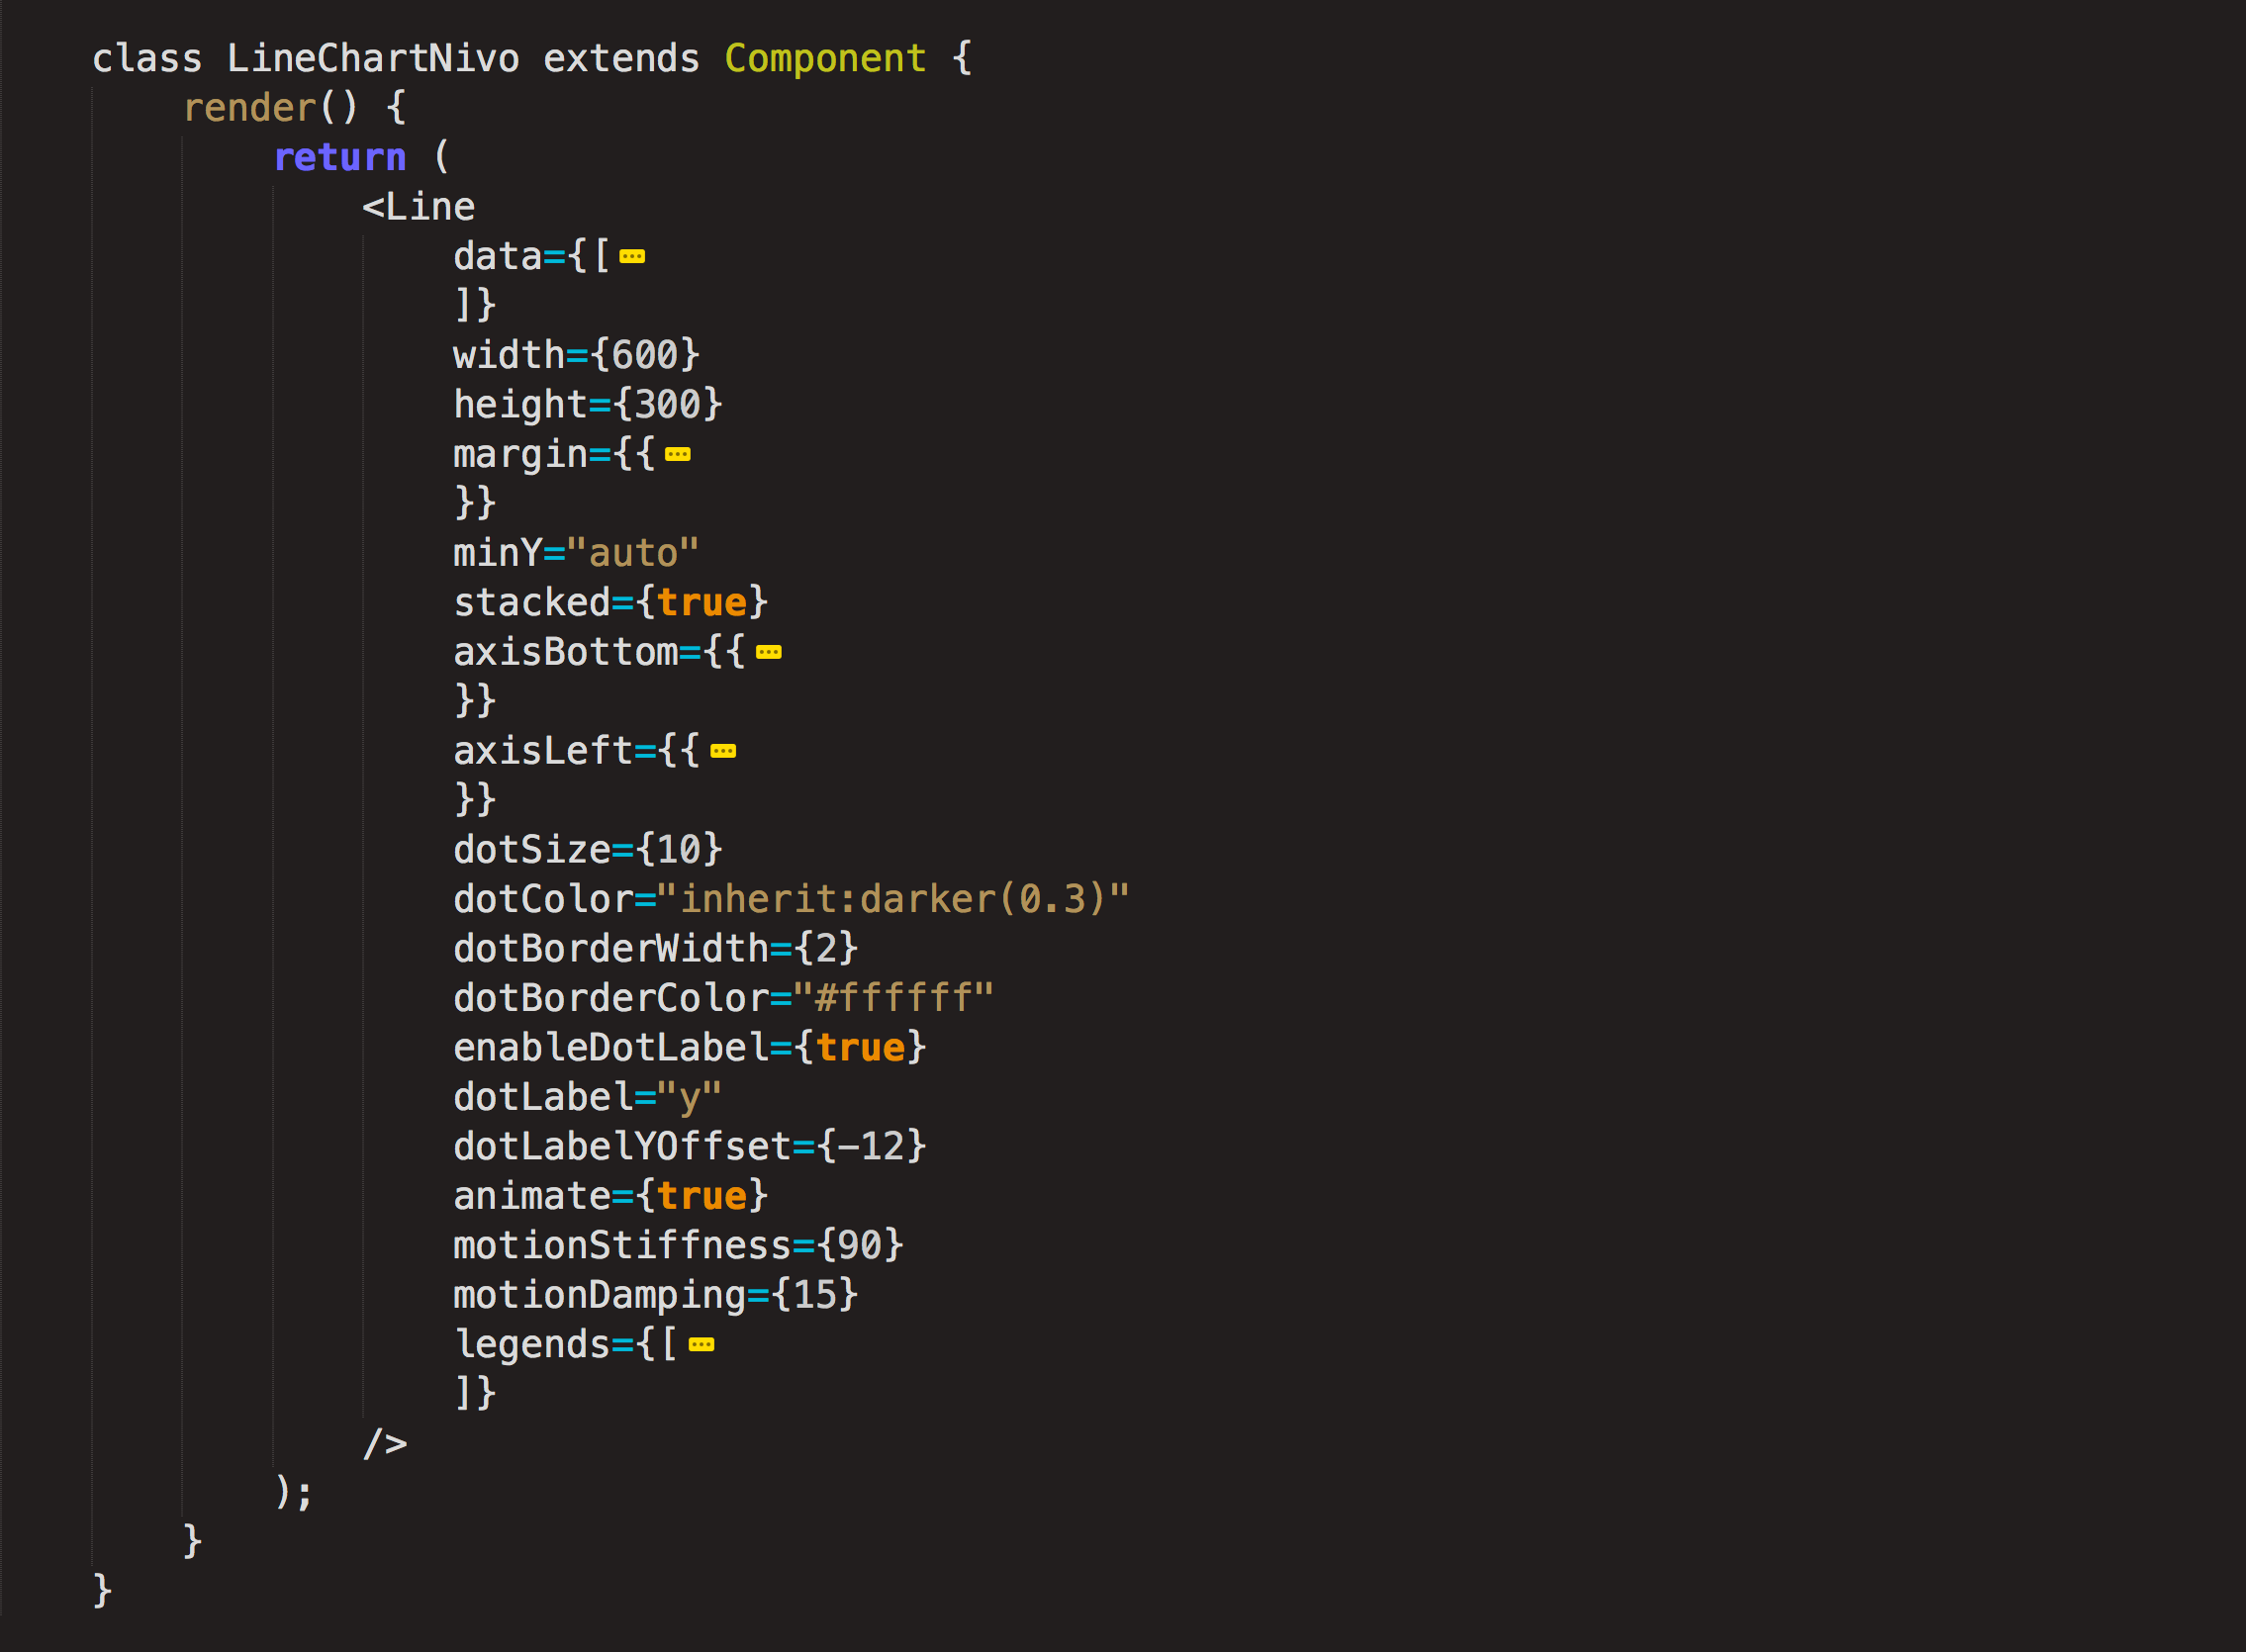
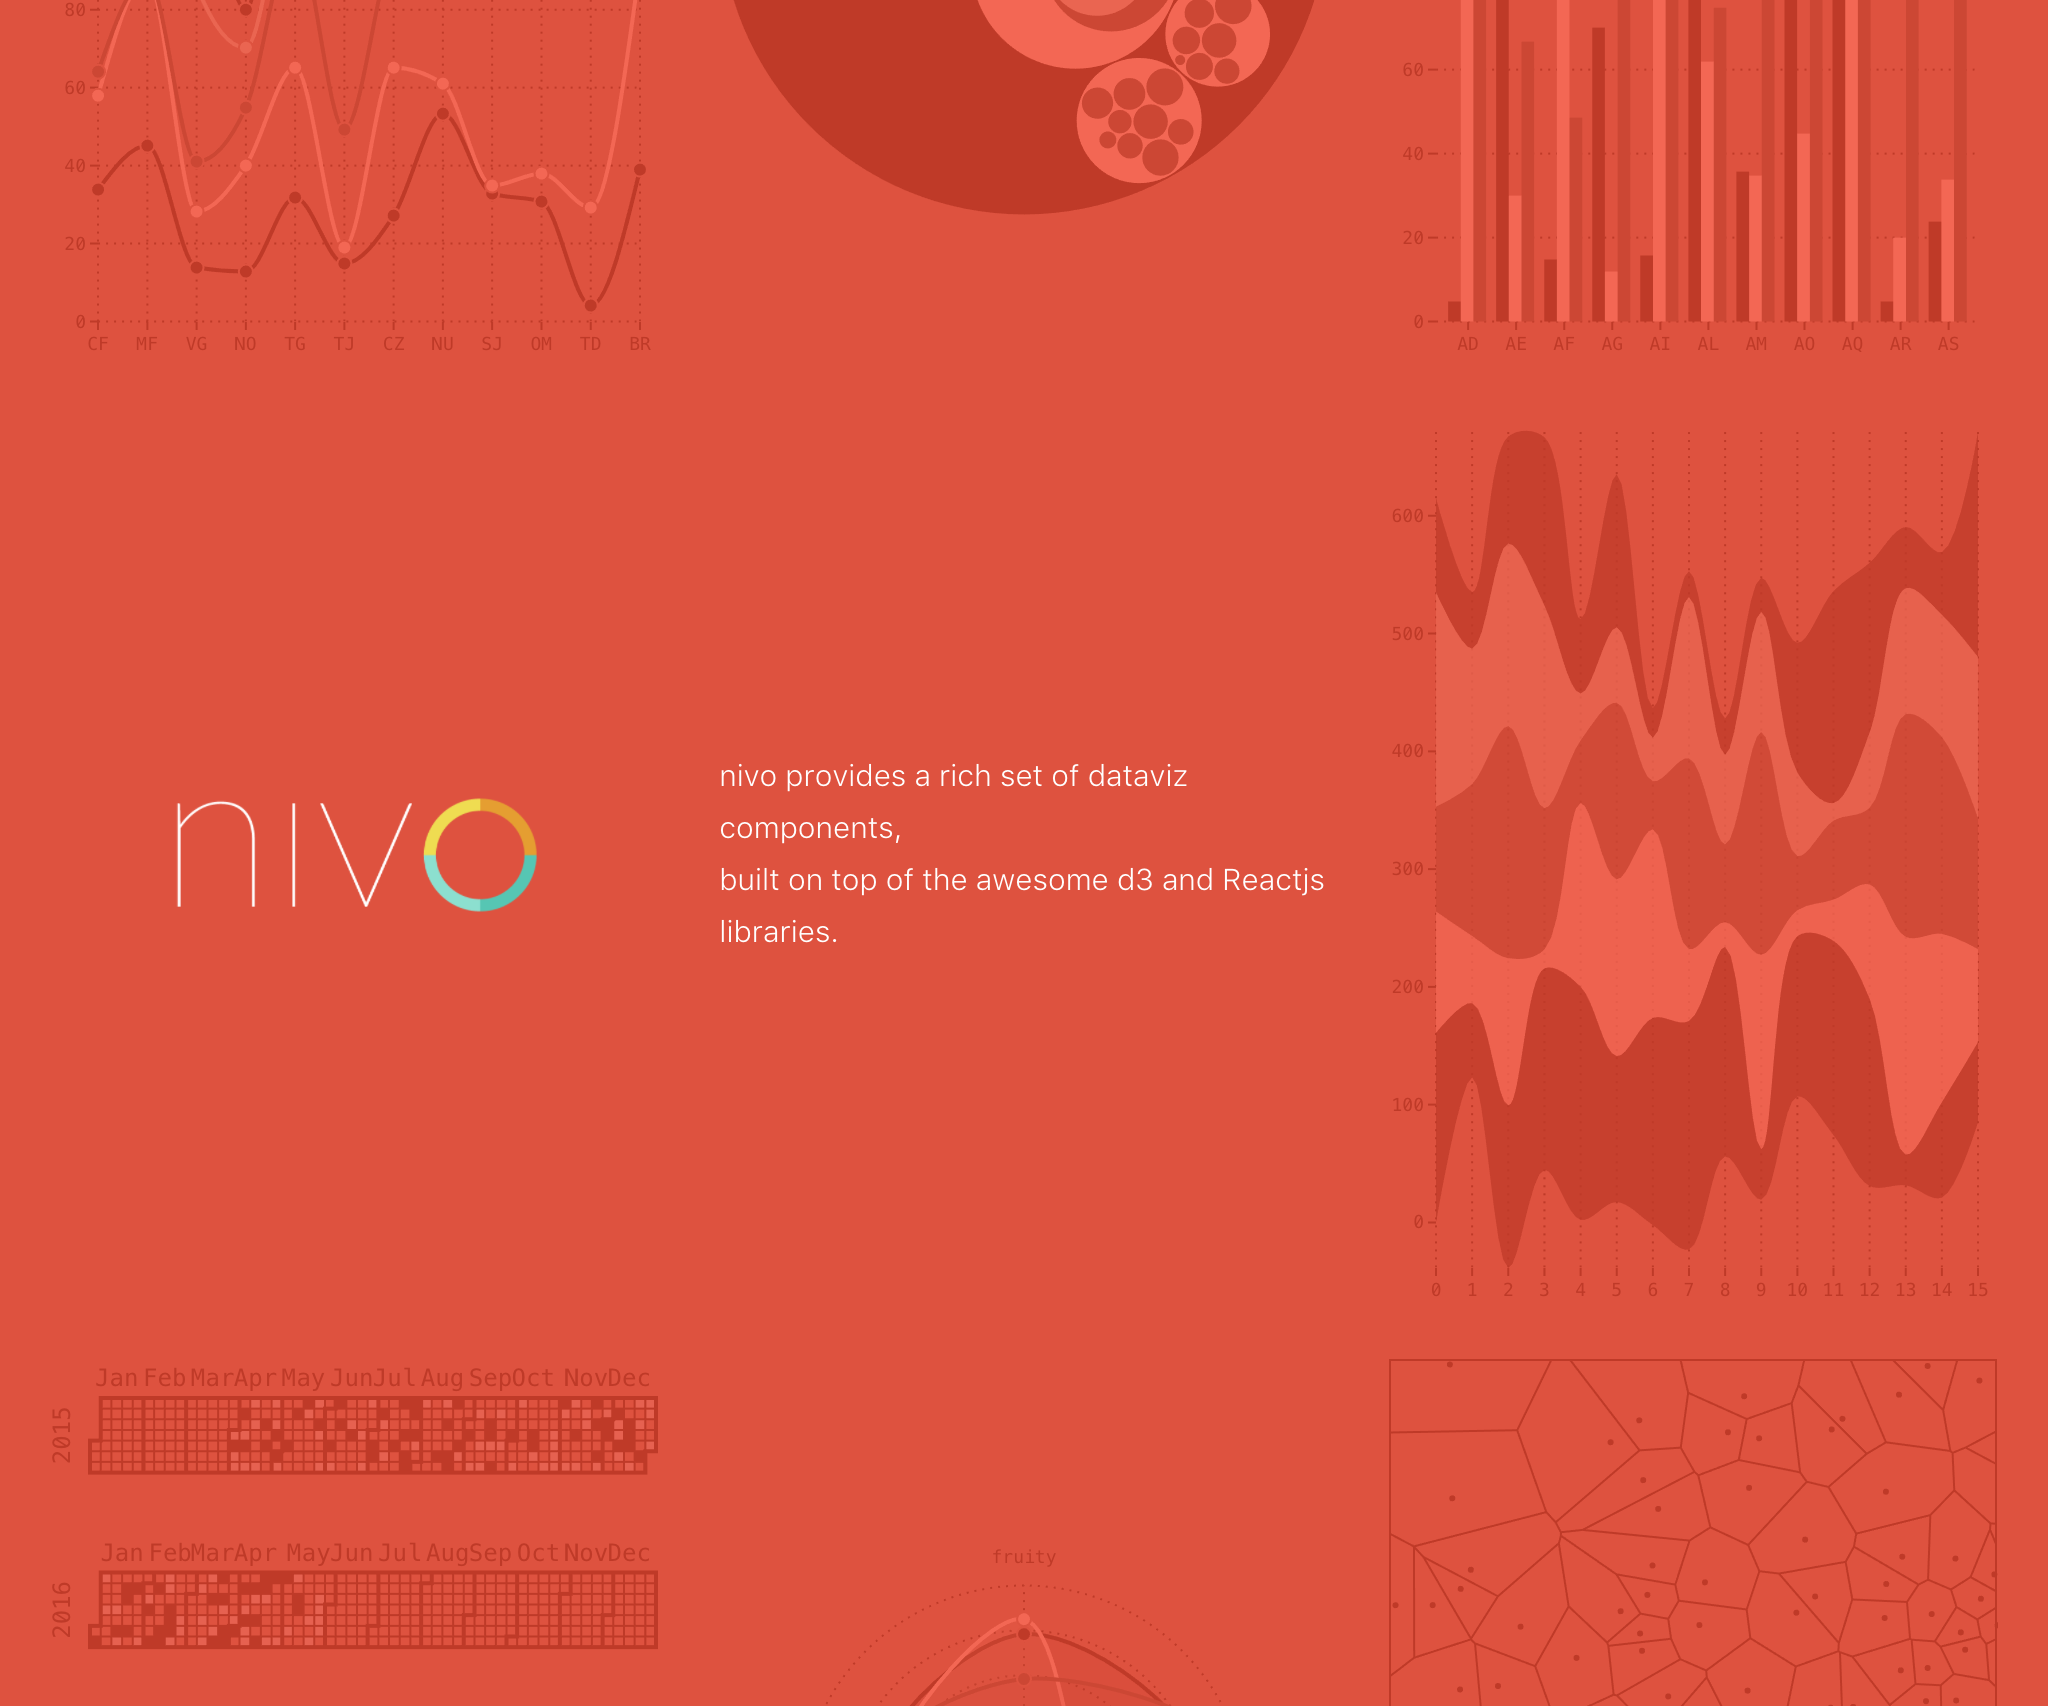
Nivo
- Different rendering options
- Animations with react-motion
- Great Docs
Linechart Code
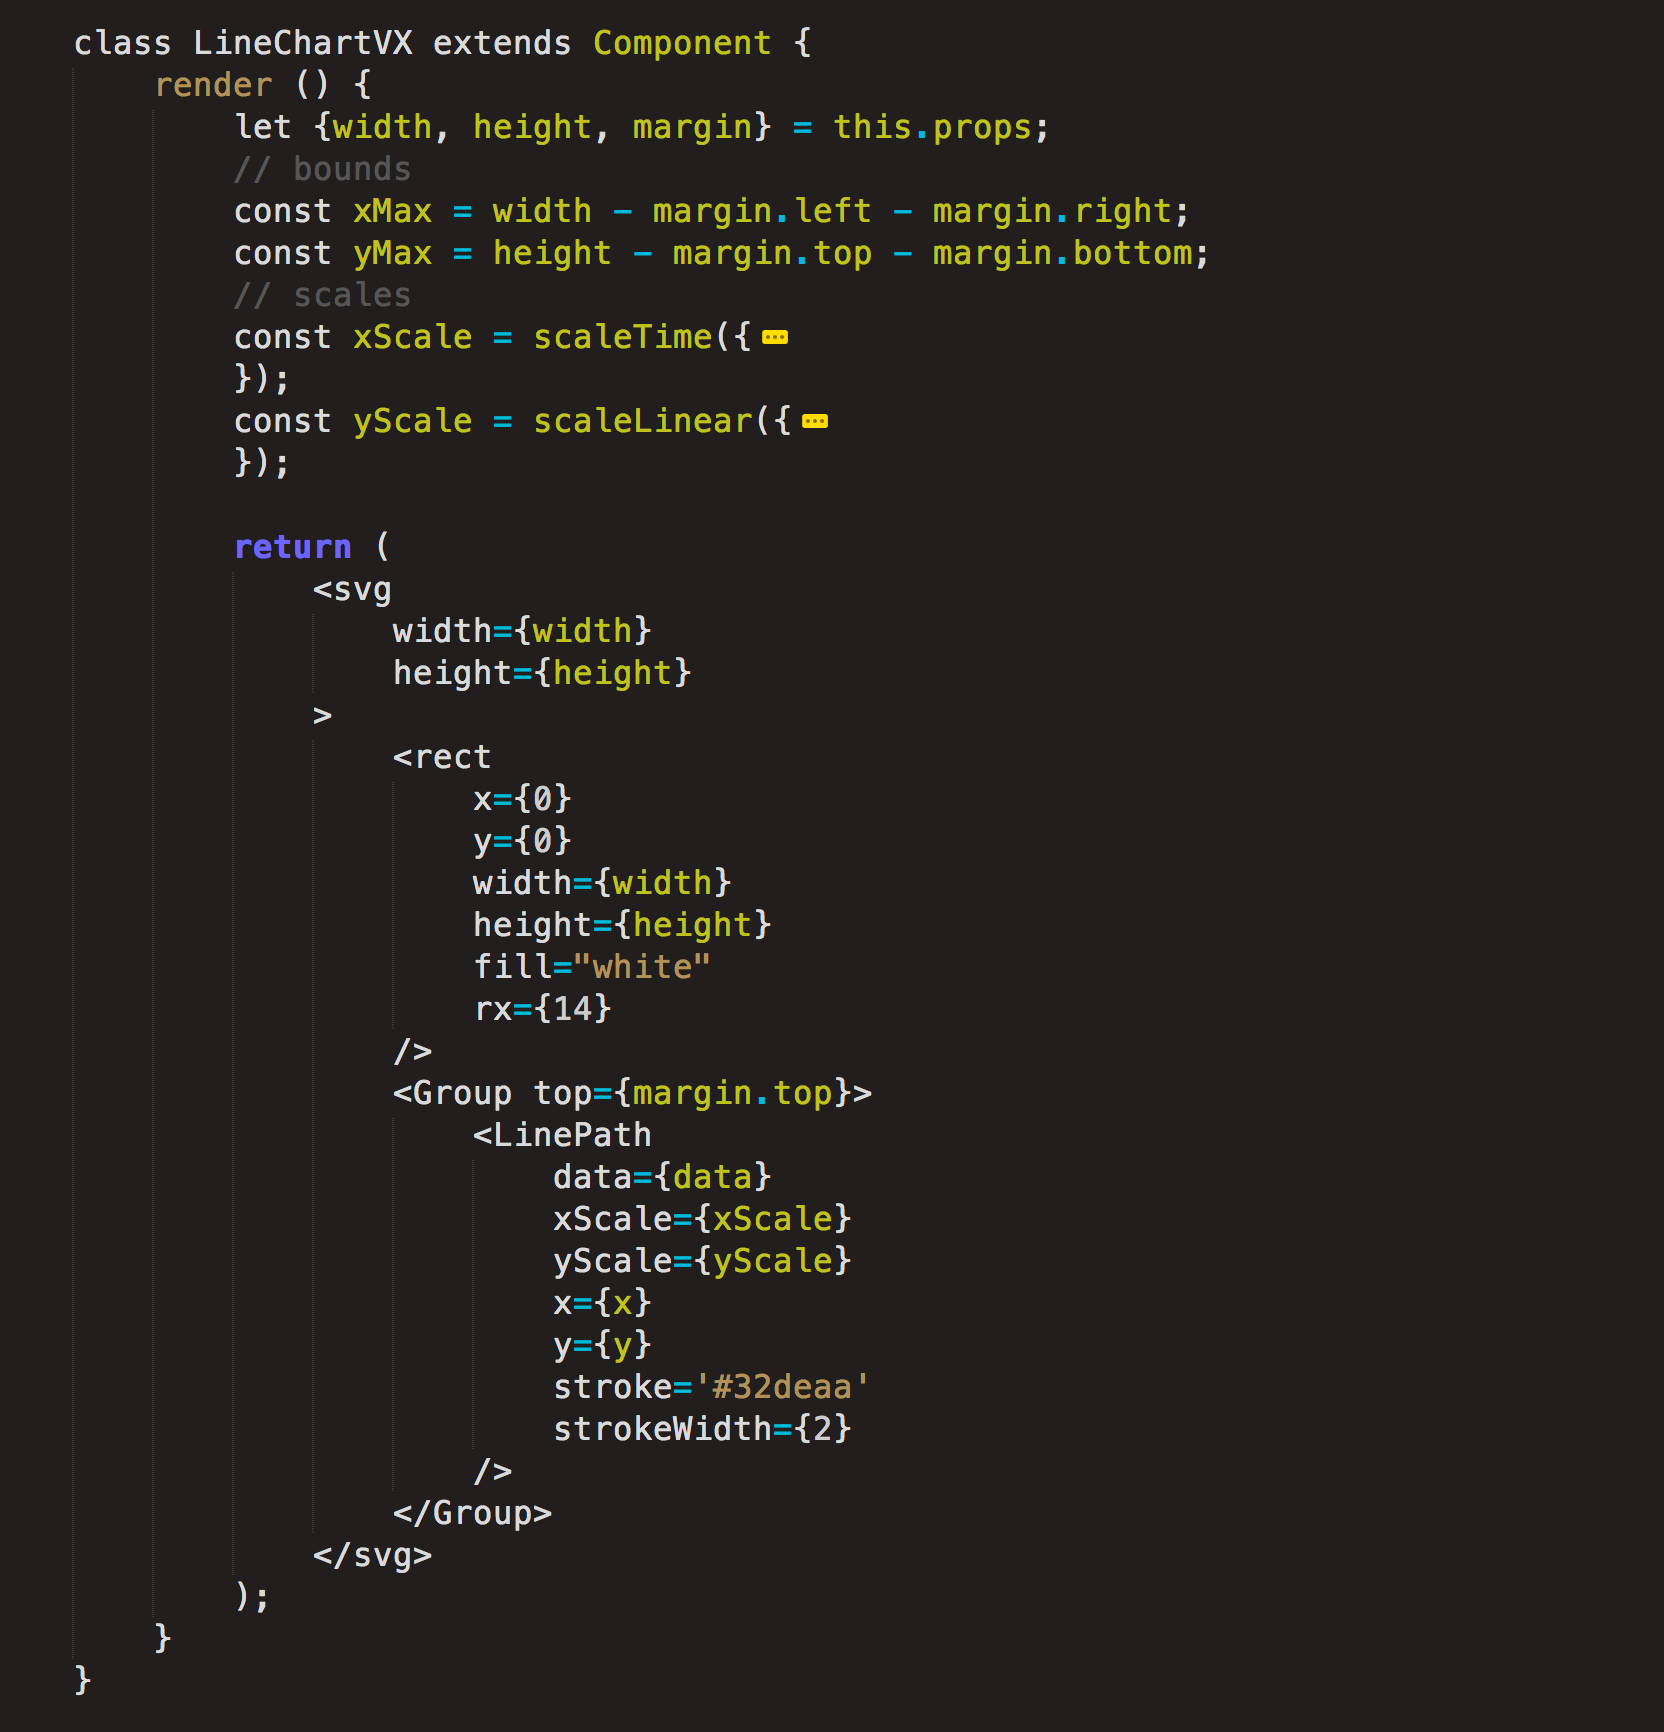
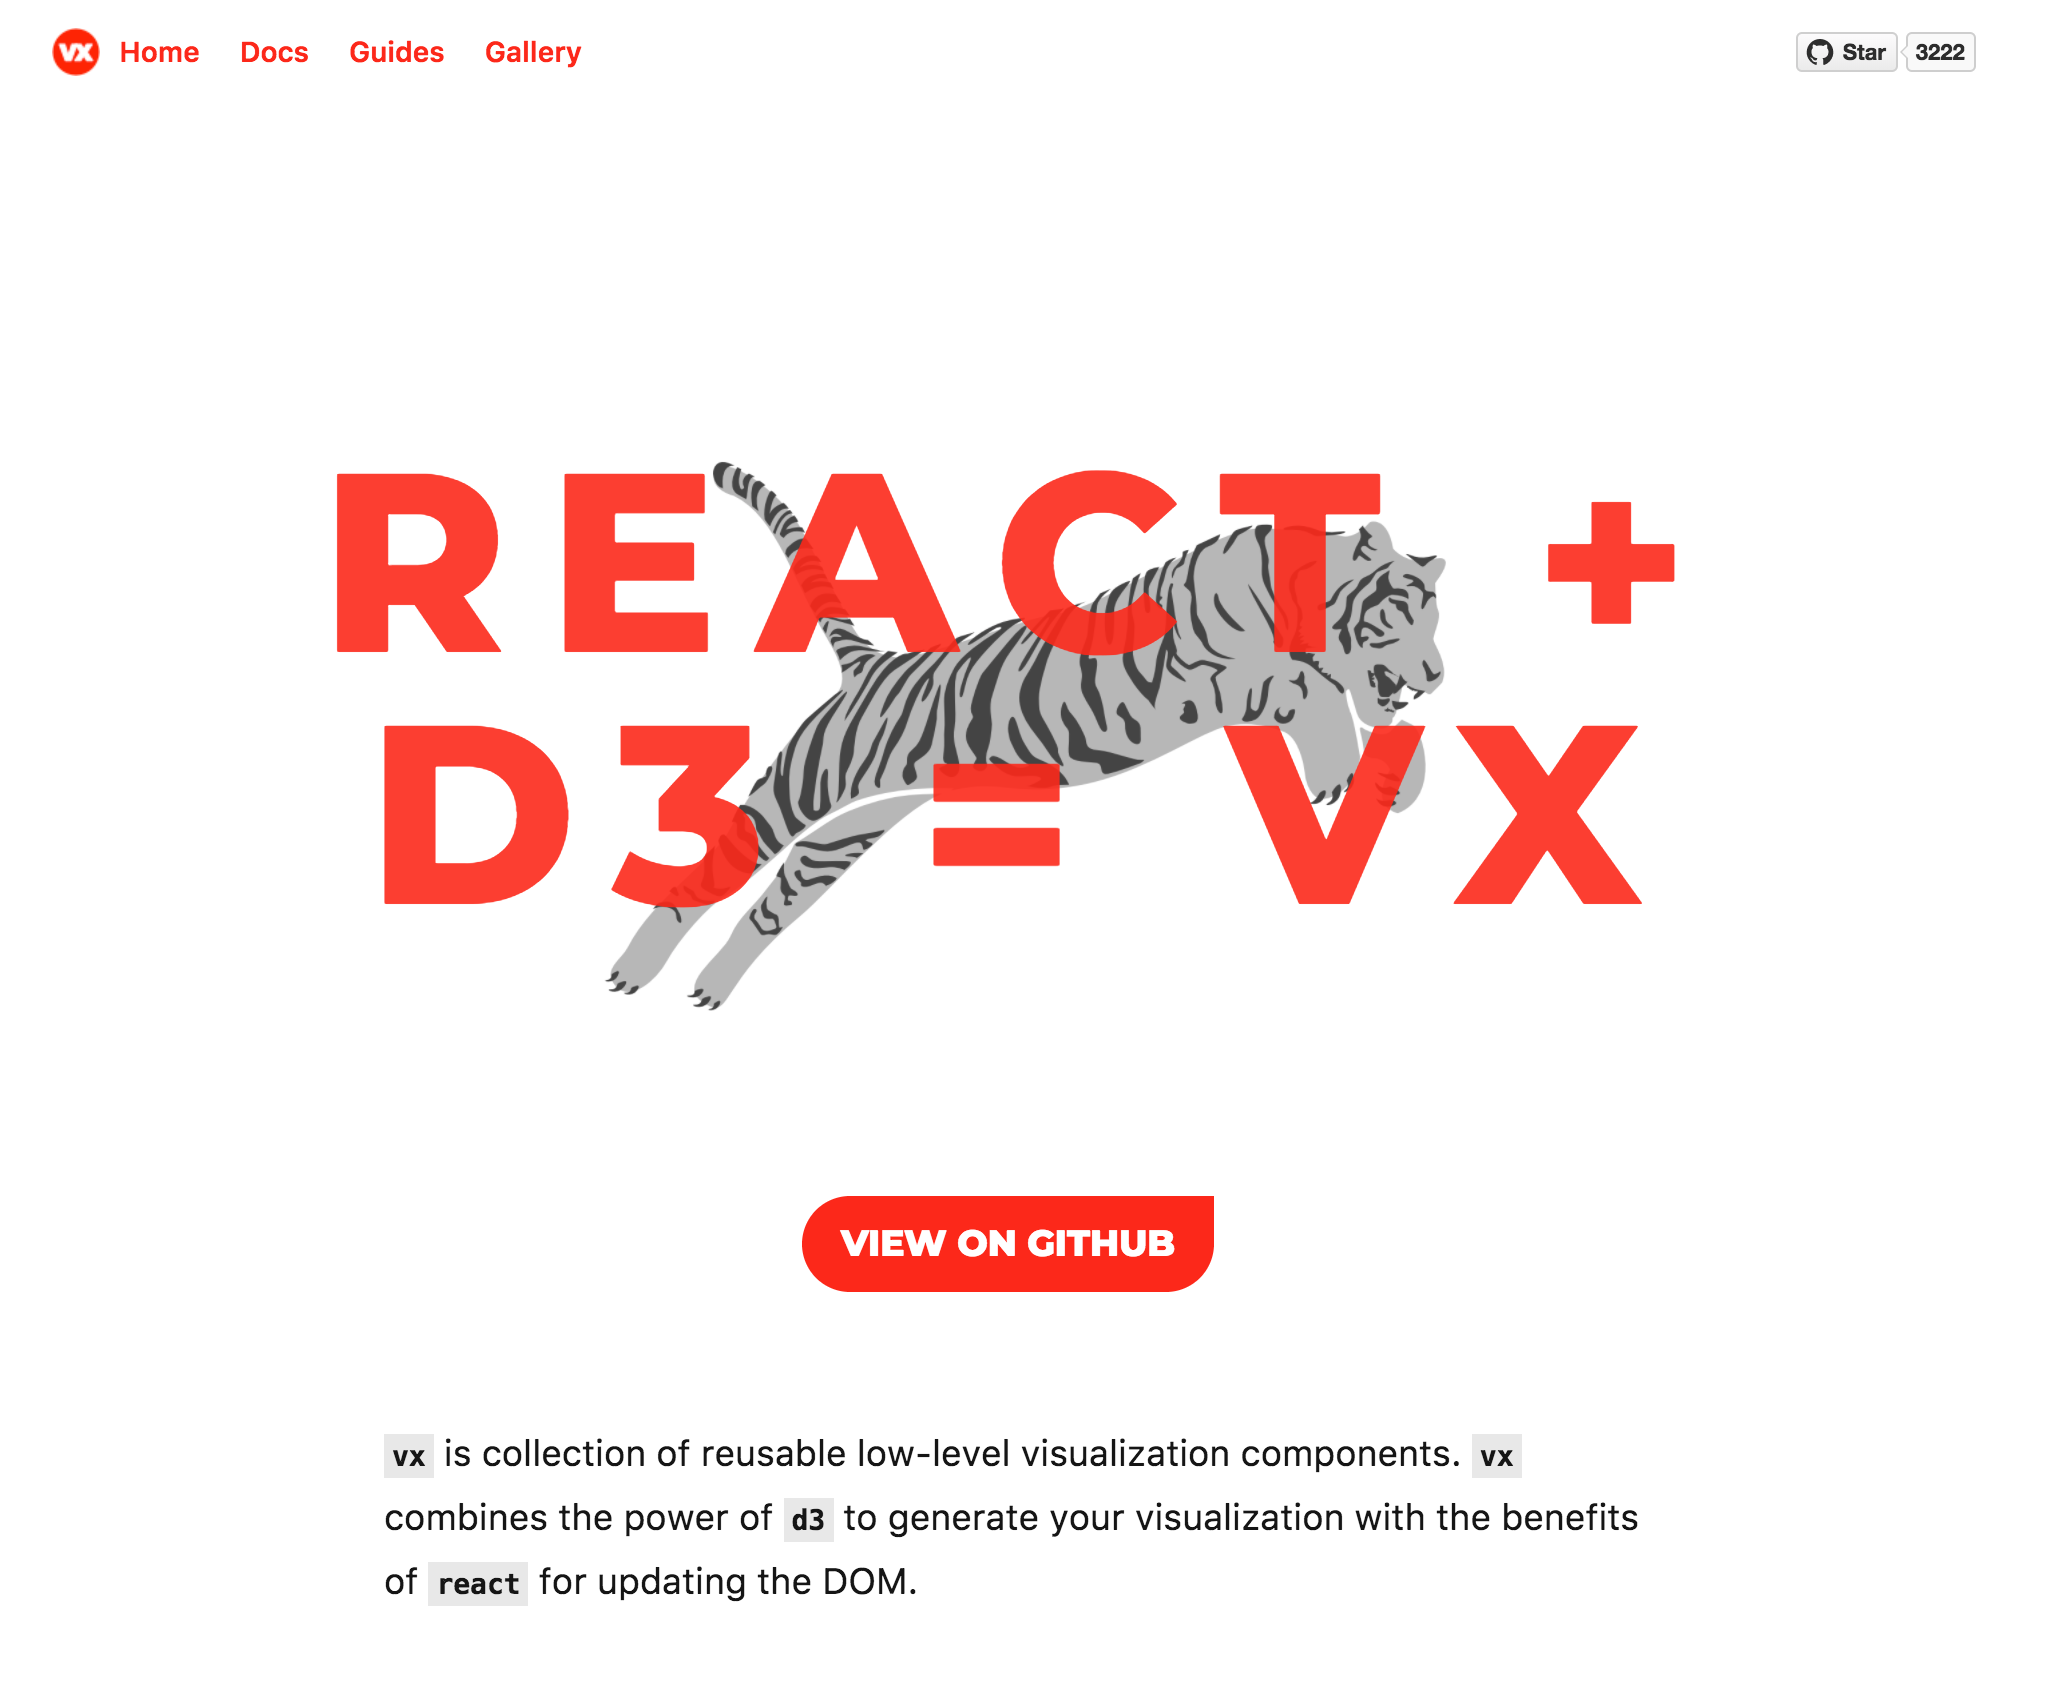
VX
- Similar to a "D3.js for React"
- Flexible about the animation library
Linechart Code
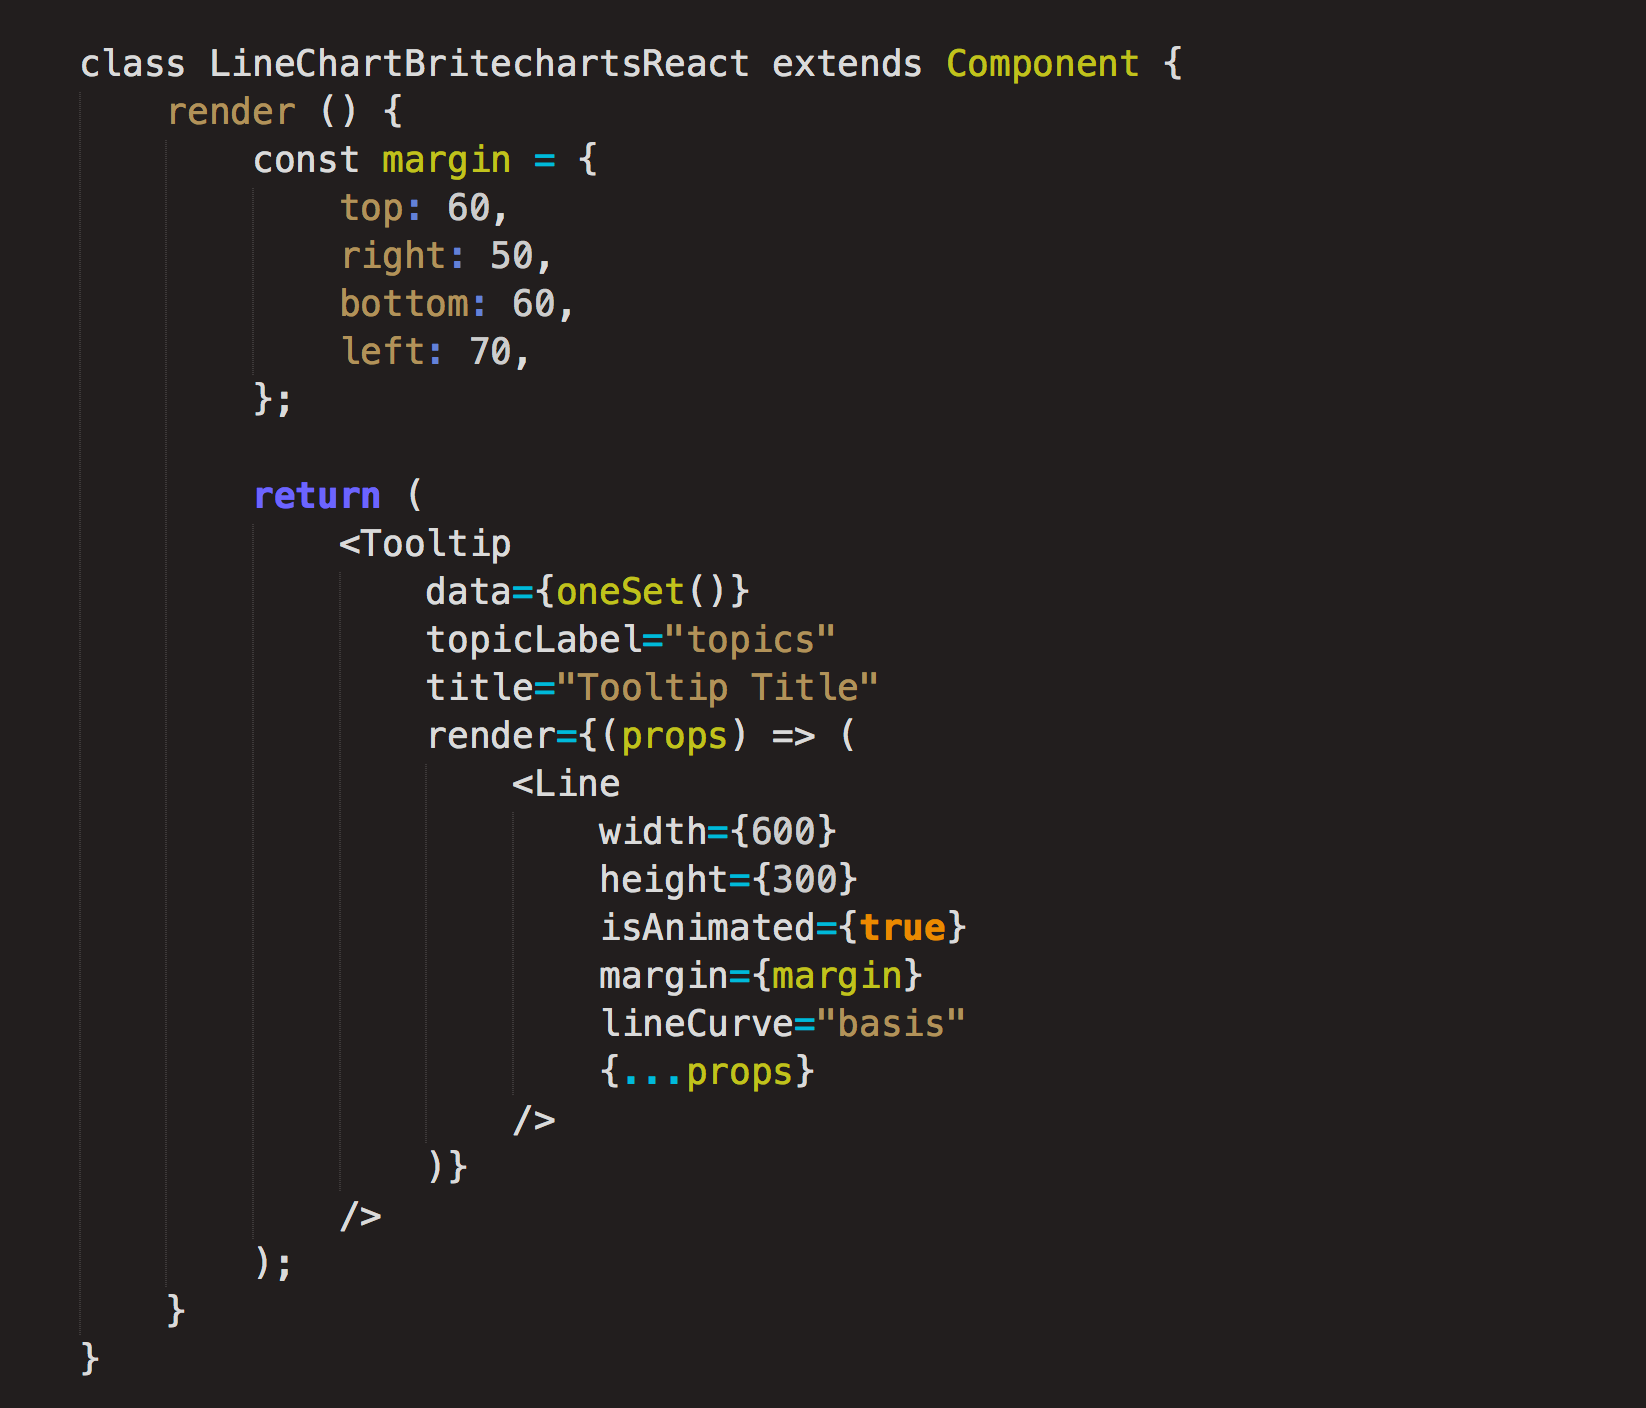
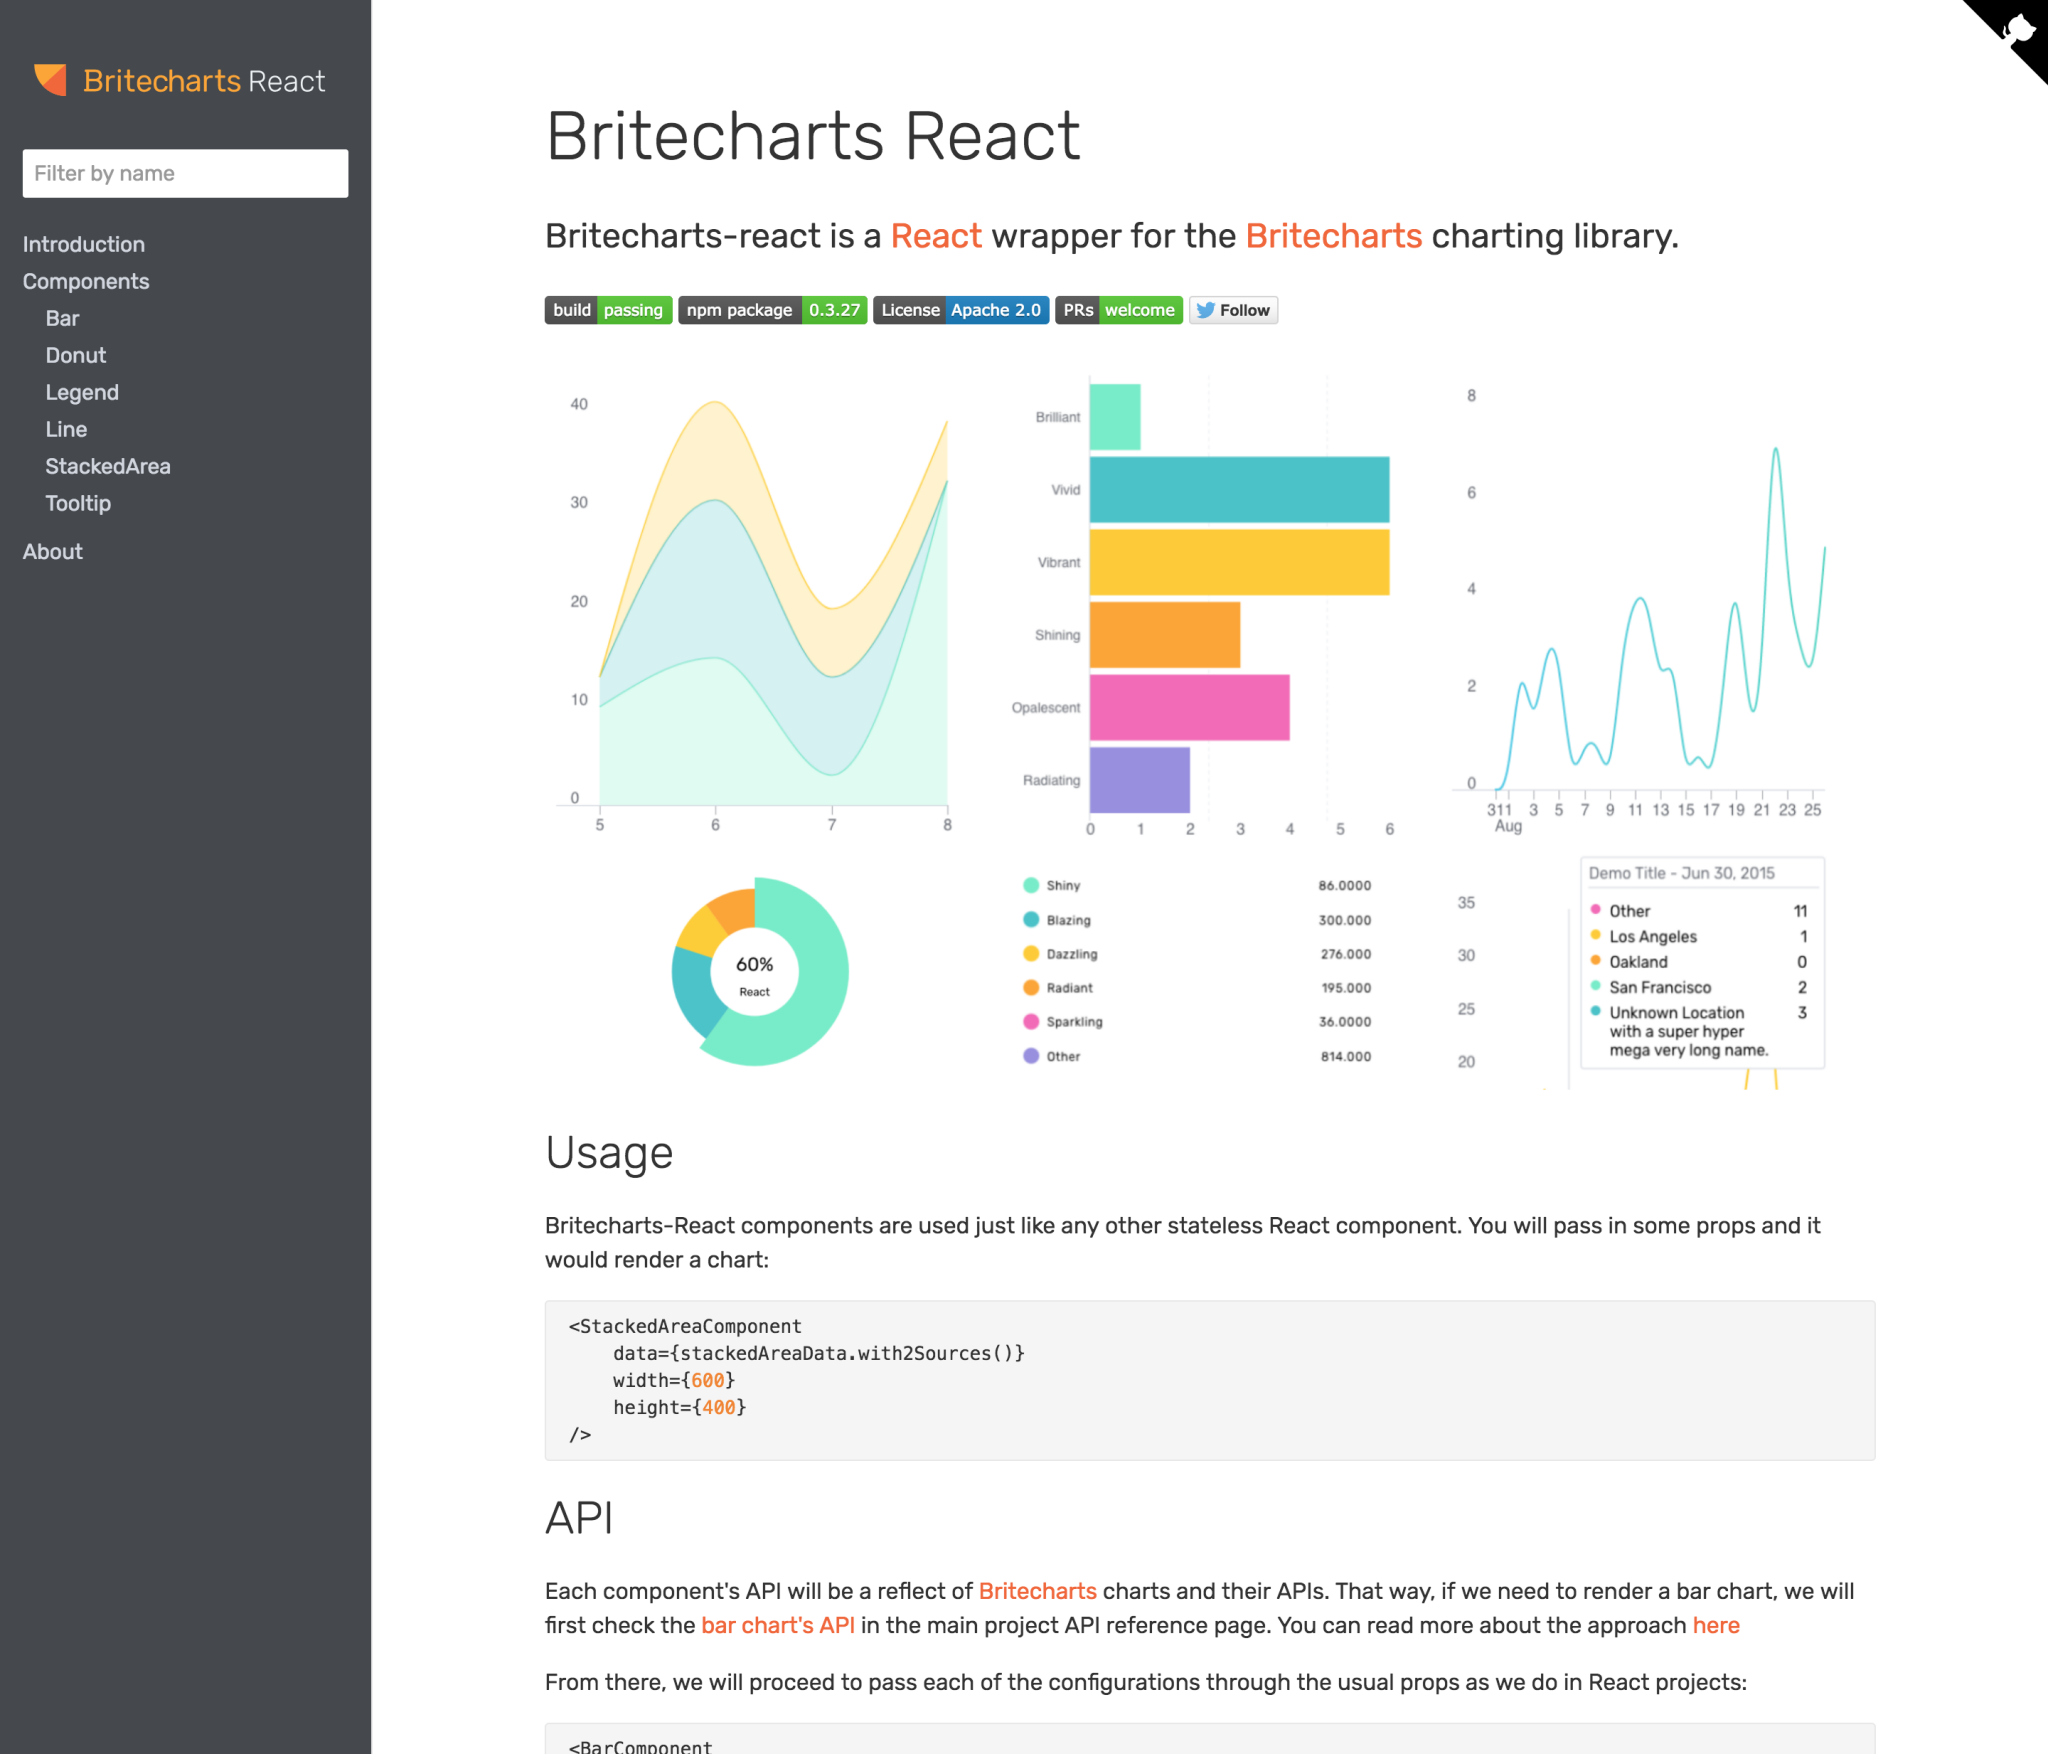
Britecharts React
- Helps to render D3 in React components
- No Server-side Rendering
Choosing an approach
Choosing criteria

- Well tested
- D3 V4
- Great docs
- Long term investment?
- Needs to be done ASAP?
- Basic charts?
- One-off work?
- Highly customized?
- Limited budget?
- Need training?
Conclusions
- D3 and React can work together
- They both move fast
- Hard to decide
Data-Joins Resources

 Demo: https://golodhros.github.io/talk-react-d3/
Code: https://github.com/Golodhros/talk-react-d3
Demo: https://golodhros.github.io/talk-react-d3/
Code: https://github.com/Golodhros/talk-react-d3
 http://tinyurl.com/d3-react-lib-comparative